Immigrants from Micronesia vs White/Caucasian Female Poverty
COMPARE
Immigrants from Micronesia
White/Caucasian
Female Poverty
Female Poverty Comparison
Immigrants from Micronesia
Whites/Caucasians
14.6%
FEMALE POVERTY
2.8/ 100
METRIC RATING
225th/ 347
METRIC RANK
13.4%
FEMALE POVERTY
54.6/ 100
METRIC RATING
171st/ 347
METRIC RANK
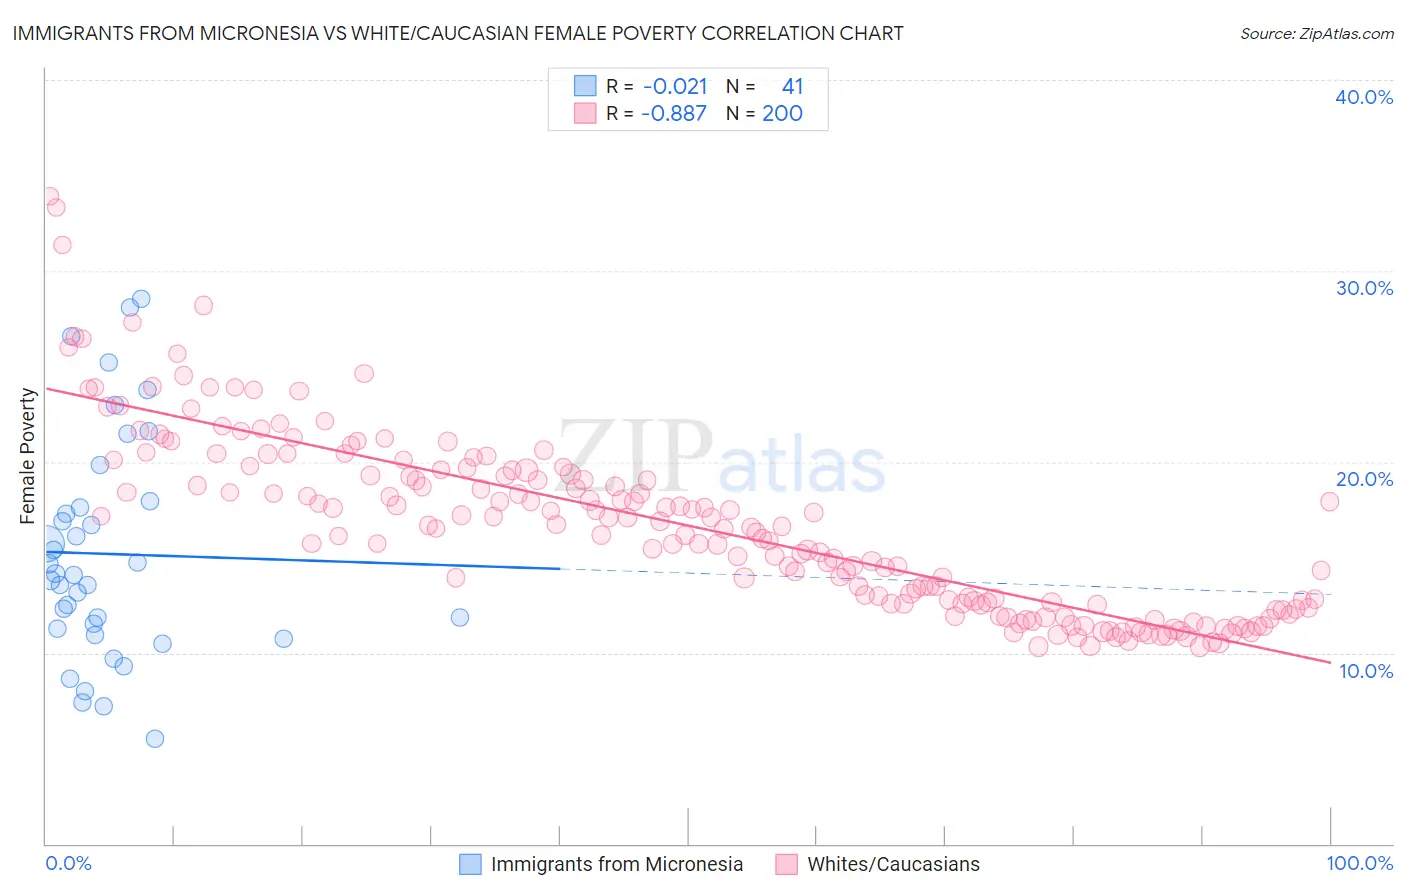
Immigrants from Micronesia vs White/Caucasian Female Poverty Correlation Chart
The statistical analysis conducted on geographies consisting of 61,598,516 people shows no correlation between the proportion of Immigrants from Micronesia and poverty level among females in the United States with a correlation coefficient (R) of -0.021 and weighted average of 14.6%. Similarly, the statistical analysis conducted on geographies consisting of 583,112,868 people shows a very strong negative correlation between the proportion of Whites/Caucasians and poverty level among females in the United States with a correlation coefficient (R) of -0.887 and weighted average of 13.4%, a difference of 9.0%.
Female Poverty Correlation Summary
| Measurement | Immigrants from Micronesia | White/Caucasian |
| Minimum | 5.5% | 10.3% |
| Maximum | 28.6% | 33.9% |
| Range | 23.0% | 23.6% |
| Mean | 15.2% | 16.7% |
| Median | 14.1% | 16.5% |
| Interquartile 25% (IQ1) | 11.1% | 12.6% |
| Interquartile 75% (IQ3) | 17.8% | 19.6% |
| Interquartile Range (IQR) | 6.7% | 7.0% |
| Standard Deviation (Sample) | 5.8% | 4.7% |
| Standard Deviation (Population) | 5.7% | 4.7% |
Similar Demographics by Female Poverty
Demographics Similar to Immigrants from Micronesia by Female Poverty
In terms of female poverty, the demographic groups most similar to Immigrants from Micronesia are American (14.6%, a difference of 0.0%), Immigrants from Eritrea (14.6%, a difference of 0.33%), Immigrants from Africa (14.5%, a difference of 0.40%), Nonimmigrants (14.5%, a difference of 0.63%), and Immigrants from Nigeria (14.7%, a difference of 0.64%).
| Demographics | Rating | Rank | Female Poverty |
| Immigrants | Uzbekistan | 4.4 /100 | #218 | Tragic 14.4% |
| Japanese | 4.1 /100 | #219 | Tragic 14.5% |
| Alsatians | 4.0 /100 | #220 | Tragic 14.5% |
| Immigrants | Cambodia | 3.7 /100 | #221 | Tragic 14.5% |
| Immigrants | Nonimmigrants | 3.7 /100 | #222 | Tragic 14.5% |
| Immigrants | Africa | 3.3 /100 | #223 | Tragic 14.5% |
| Americans | 2.8 /100 | #224 | Tragic 14.6% |
| Immigrants | Micronesia | 2.8 /100 | #225 | Tragic 14.6% |
| Immigrants | Eritrea | 2.4 /100 | #226 | Tragic 14.6% |
| Immigrants | Nigeria | 2.1 /100 | #227 | Tragic 14.7% |
| German Russians | 2.0 /100 | #228 | Tragic 14.7% |
| Ghanaians | 1.9 /100 | #229 | Tragic 14.7% |
| Alaska Natives | 1.8 /100 | #230 | Tragic 14.7% |
| Nigerians | 1.7 /100 | #231 | Tragic 14.8% |
| Osage | 1.5 /100 | #232 | Tragic 14.8% |
Demographics Similar to Whites/Caucasians by Female Poverty
In terms of female poverty, the demographic groups most similar to Whites/Caucasians are Mongolian (13.4%, a difference of 0.10%), Colombian (13.4%, a difference of 0.11%), Lebanese (13.4%, a difference of 0.13%), Aleut (13.4%, a difference of 0.21%), and Immigrants from Chile (13.3%, a difference of 0.27%).
| Demographics | Rating | Rank | Female Poverty |
| Ethiopians | 62.3 /100 | #164 | Good 13.3% |
| Scotch-Irish | 62.1 /100 | #165 | Good 13.3% |
| Immigrants | Oceania | 59.7 /100 | #166 | Average 13.3% |
| Immigrants | Chile | 57.4 /100 | #167 | Average 13.3% |
| Aleuts | 56.7 /100 | #168 | Average 13.4% |
| Lebanese | 55.9 /100 | #169 | Average 13.4% |
| Colombians | 55.7 /100 | #170 | Average 13.4% |
| Whites/Caucasians | 54.6 /100 | #171 | Average 13.4% |
| Mongolians | 53.6 /100 | #172 | Average 13.4% |
| Immigrants | Afghanistan | 50.8 /100 | #173 | Average 13.4% |
| Immigrants | Iraq | 50.0 /100 | #174 | Average 13.4% |
| Celtics | 49.9 /100 | #175 | Average 13.4% |
| Immigrants | Spain | 49.9 /100 | #176 | Average 13.4% |
| Immigrants | Morocco | 49.4 /100 | #177 | Average 13.4% |
| Israelis | 49.1 /100 | #178 | Average 13.5% |