Immigrants from Bosnia and Herzegovina vs White/Caucasian Female Poverty
COMPARE
Immigrants from Bosnia and Herzegovina
White/Caucasian
Female Poverty
Female Poverty Comparison
Immigrants from Bosnia and Herzegovina
Whites/Caucasians
13.2%
FEMALE POVERTY
69.7/ 100
METRIC RATING
156th/ 347
METRIC RANK
13.4%
FEMALE POVERTY
54.6/ 100
METRIC RATING
171st/ 347
METRIC RANK
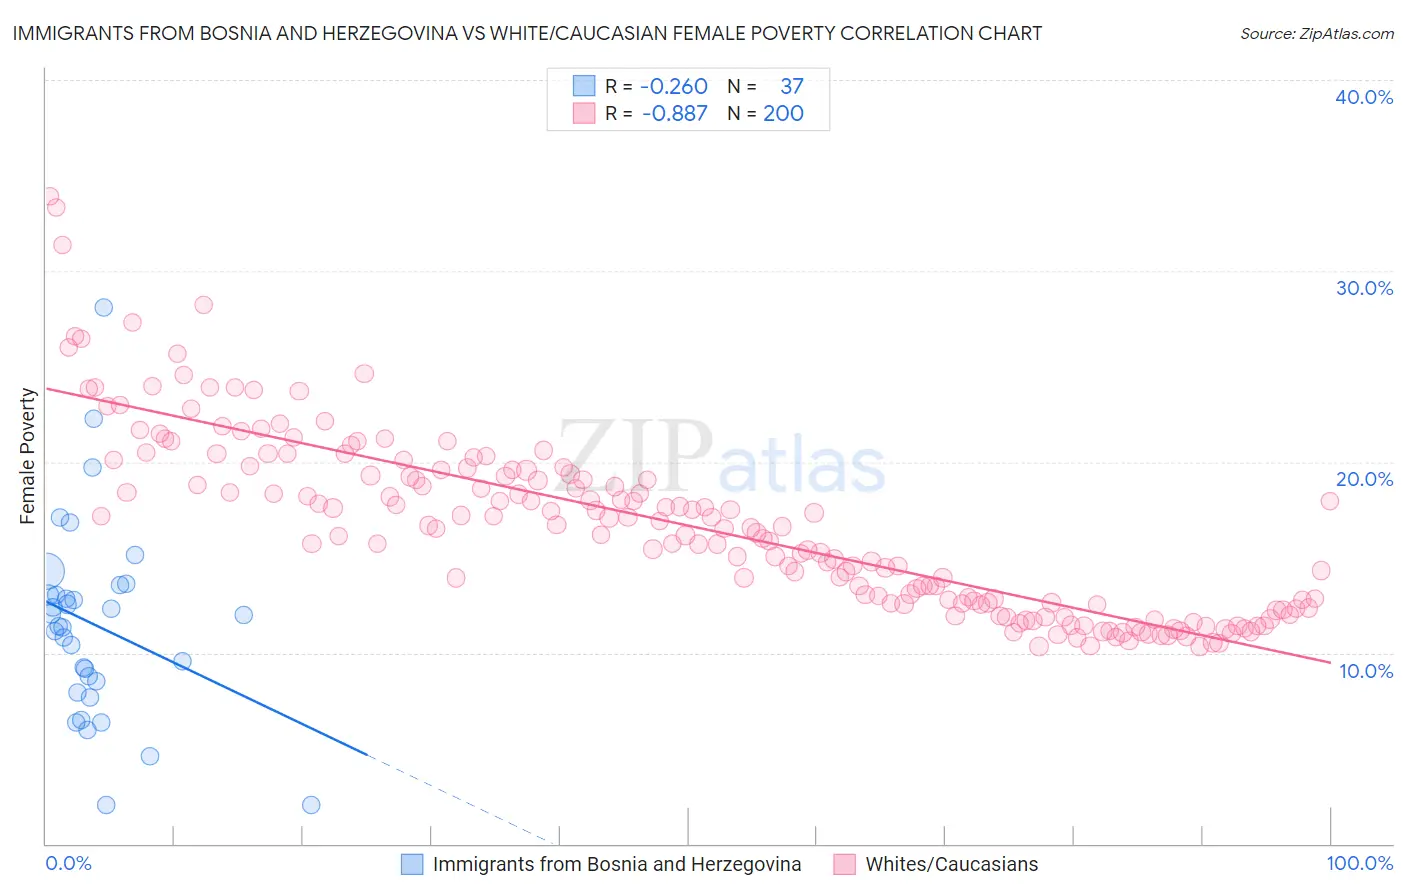
Immigrants from Bosnia and Herzegovina vs White/Caucasian Female Poverty Correlation Chart
The statistical analysis conducted on geographies consisting of 156,760,693 people shows a weak negative correlation between the proportion of Immigrants from Bosnia and Herzegovina and poverty level among females in the United States with a correlation coefficient (R) of -0.260 and weighted average of 13.2%. Similarly, the statistical analysis conducted on geographies consisting of 583,112,868 people shows a very strong negative correlation between the proportion of Whites/Caucasians and poverty level among females in the United States with a correlation coefficient (R) of -0.887 and weighted average of 13.4%, a difference of 1.6%.
Female Poverty Correlation Summary
| Measurement | Immigrants from Bosnia and Herzegovina | White/Caucasian |
| Minimum | 2.0% | 10.3% |
| Maximum | 28.1% | 33.9% |
| Range | 26.1% | 23.6% |
| Mean | 11.4% | 16.7% |
| Median | 11.4% | 16.5% |
| Interquartile 25% (IQ1) | 8.2% | 12.6% |
| Interquartile 75% (IQ3) | 13.3% | 19.6% |
| Interquartile Range (IQR) | 5.1% | 7.0% |
| Standard Deviation (Sample) | 5.2% | 4.7% |
| Standard Deviation (Population) | 5.1% | 4.7% |
Demographics Similar to Immigrants from Bosnia and Herzegovina and Whites/Caucasians by Female Poverty
In terms of female poverty, the demographic groups most similar to Immigrants from Bosnia and Herzegovina are Hungarian (13.2%, a difference of 0.050%), Armenian (13.2%, a difference of 0.090%), Immigrants from Northern Africa (13.2%, a difference of 0.10%), Immigrants from Fiji (13.2%, a difference of 0.15%), and Pennsylvania German (13.2%, a difference of 0.27%). Similarly, the demographic groups most similar to Whites/Caucasians are Mongolian (13.4%, a difference of 0.10%), Colombian (13.4%, a difference of 0.11%), Lebanese (13.4%, a difference of 0.13%), Aleut (13.4%, a difference of 0.21%), and Immigrants from Chile (13.3%, a difference of 0.27%).
| Demographics | Rating | Rank | Female Poverty |
| Immigrants | Fiji | 71.0 /100 | #153 | Good 13.2% |
| Armenians | 70.4 /100 | #154 | Good 13.2% |
| Hungarians | 70.1 /100 | #155 | Good 13.2% |
| Immigrants | Bosnia and Herzegovina | 69.7 /100 | #156 | Good 13.2% |
| Immigrants | Northern Africa | 68.8 /100 | #157 | Good 13.2% |
| Pennsylvania Germans | 67.3 /100 | #158 | Good 13.2% |
| Costa Ricans | 63.6 /100 | #159 | Good 13.3% |
| Immigrants | Nepal | 62.7 /100 | #160 | Good 13.3% |
| Immigrants | Ethiopia | 62.5 /100 | #161 | Good 13.3% |
| Guamanians/Chamorros | 62.4 /100 | #162 | Good 13.3% |
| Immigrants | Albania | 62.4 /100 | #163 | Good 13.3% |
| Ethiopians | 62.3 /100 | #164 | Good 13.3% |
| Scotch-Irish | 62.1 /100 | #165 | Good 13.3% |
| Immigrants | Oceania | 59.7 /100 | #166 | Average 13.3% |
| Immigrants | Chile | 57.4 /100 | #167 | Average 13.3% |
| Aleuts | 56.7 /100 | #168 | Average 13.4% |
| Lebanese | 55.9 /100 | #169 | Average 13.4% |
| Colombians | 55.7 /100 | #170 | Average 13.4% |
| Whites/Caucasians | 54.6 /100 | #171 | Average 13.4% |
| Mongolians | 53.6 /100 | #172 | Average 13.4% |
| Immigrants | Afghanistan | 50.8 /100 | #173 | Average 13.4% |