Immigrants from Caribbean vs Dominican Receiving Food Stamps
COMPARE
Immigrants from Caribbean
Dominican
Receiving Food Stamps
Receiving Food Stamps Comparison
Immigrants from Caribbean
Dominicans
19.6%
RECEIVING FOOD STAMPS
0.0/ 100
METRIC RATING
331st/ 347
METRIC RANK
21.4%
RECEIVING FOOD STAMPS
0.0/ 100
METRIC RATING
338th/ 347
METRIC RANK
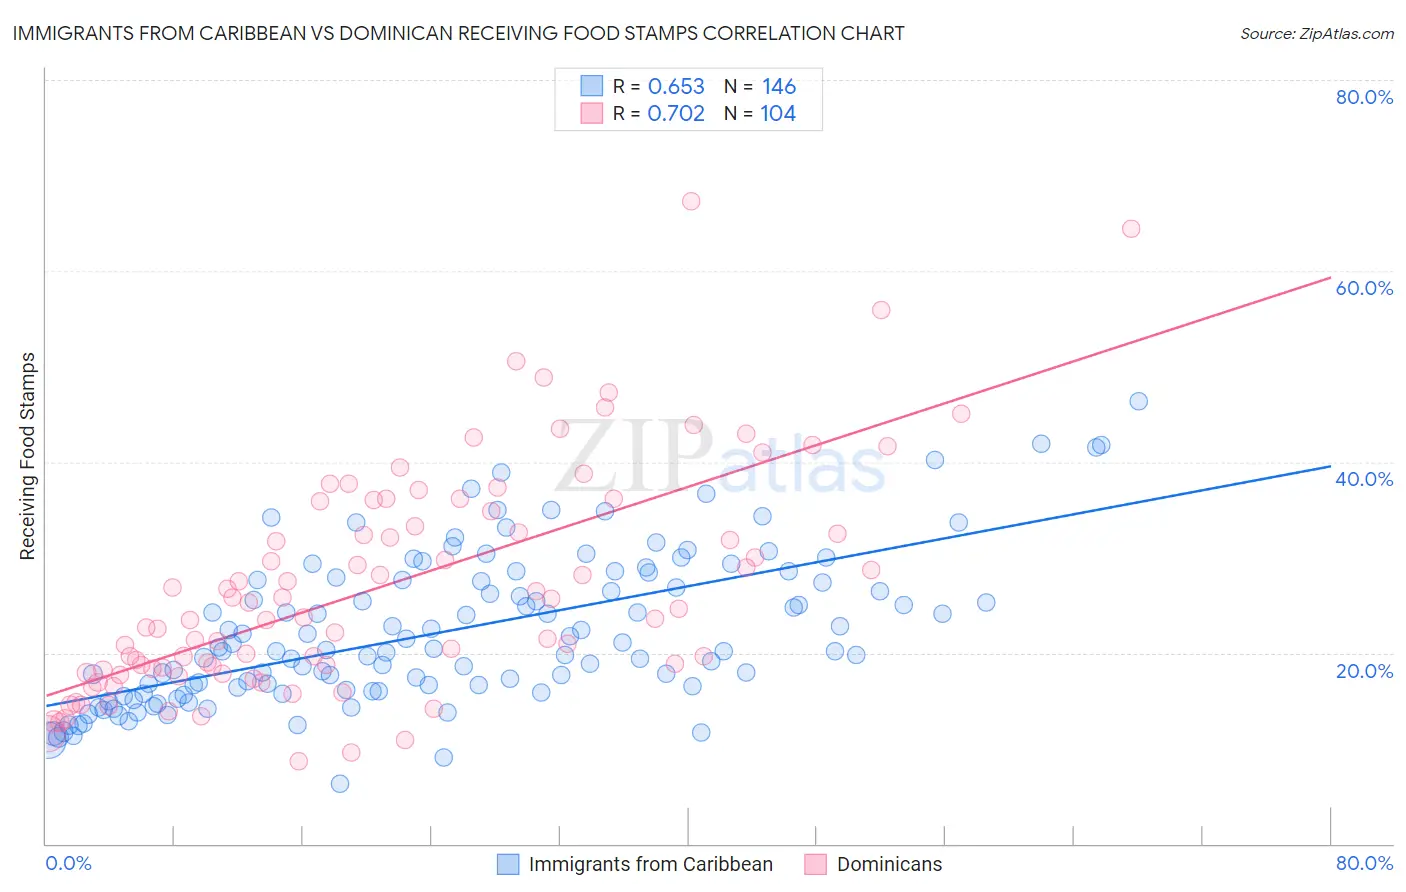
Immigrants from Caribbean vs Dominican Receiving Food Stamps Correlation Chart
The statistical analysis conducted on geographies consisting of 448,445,784 people shows a significant positive correlation between the proportion of Immigrants from Caribbean and percentage of population receiving government assistance and/or food stamps in the United States with a correlation coefficient (R) of 0.653 and weighted average of 19.6%. Similarly, the statistical analysis conducted on geographies consisting of 353,995,756 people shows a strong positive correlation between the proportion of Dominicans and percentage of population receiving government assistance and/or food stamps in the United States with a correlation coefficient (R) of 0.702 and weighted average of 21.4%, a difference of 8.9%.
Receiving Food Stamps Correlation Summary
| Measurement | Immigrants from Caribbean | Dominican |
| Minimum | 6.3% | 8.7% |
| Maximum | 46.4% | 67.3% |
| Range | 40.1% | 58.6% |
| Mean | 22.2% | 27.0% |
| Median | 20.3% | 24.1% |
| Interquartile 25% (IQ1) | 16.1% | 18.3% |
| Interquartile 75% (IQ3) | 27.7% | 35.4% |
| Interquartile Range (IQR) | 11.5% | 17.1% |
| Standard Deviation (Sample) | 7.8% | 11.8% |
| Standard Deviation (Population) | 7.8% | 11.7% |
Demographics Similar to Immigrants from Caribbean and Dominicans by Receiving Food Stamps
In terms of receiving food stamps, the demographic groups most similar to Immigrants from Caribbean are Pueblo (19.9%, a difference of 1.5%), Inupiat (20.1%, a difference of 2.2%), Yuman (20.2%, a difference of 3.1%), Pima (19.0%, a difference of 3.4%), and Immigrants from Cuba (20.8%, a difference of 6.2%). Similarly, the demographic groups most similar to Dominicans are Yakama (21.4%, a difference of 0.26%), Tohono O'odham (21.5%, a difference of 0.52%), Hopi (21.6%, a difference of 0.89%), Immigrants from Yemen (21.6%, a difference of 1.3%), and Cape Verdean (21.1%, a difference of 1.4%).
| Demographics | Rating | Rank | Receiving Food Stamps |
| British West Indians | 0.0 /100 | #324 | Tragic 17.9% |
| Immigrants | Haiti | 0.0 /100 | #325 | Tragic 18.2% |
| Cubans | 0.0 /100 | #326 | Tragic 18.2% |
| Apache | 0.0 /100 | #327 | Tragic 18.3% |
| Colville | 0.0 /100 | #328 | Tragic 18.3% |
| Immigrants | Dominica | 0.0 /100 | #329 | Tragic 18.4% |
| Pima | 0.0 /100 | #330 | Tragic 19.0% |
| Immigrants | Caribbean | 0.0 /100 | #331 | Tragic 19.6% |
| Pueblo | 0.0 /100 | #332 | Tragic 19.9% |
| Inupiat | 0.0 /100 | #333 | Tragic 20.1% |
| Yuman | 0.0 /100 | #334 | Tragic 20.2% |
| Immigrants | Cuba | 0.0 /100 | #335 | Tragic 20.8% |
| Navajo | 0.0 /100 | #336 | Tragic 21.1% |
| Cape Verdeans | 0.0 /100 | #337 | Tragic 21.1% |
| Dominicans | 0.0 /100 | #338 | Tragic 21.4% |
| Yakama | 0.0 /100 | #339 | Tragic 21.4% |
| Tohono O'odham | 0.0 /100 | #340 | Tragic 21.5% |
| Hopi | 0.0 /100 | #341 | Tragic 21.6% |
| Immigrants | Yemen | 0.0 /100 | #342 | Tragic 21.6% |
| Immigrants | Dominican Republic | 0.0 /100 | #343 | Tragic 22.1% |
| Lumbee | 0.0 /100 | #344 | Tragic 22.9% |