Immigrants from Caribbean vs Immigrants from Nepal Child Poverty Under the Age of 5
COMPARE
Immigrants from Caribbean
Immigrants from Nepal
Child Poverty Under the Age of 5
Child Poverty Under the Age of 5 Comparison
Immigrants from Caribbean
Immigrants from Nepal
21.4%
CHILD POVERTY UNDER THE AGE OF 5
0.0/ 100
METRIC RATING
290th/ 347
METRIC RANK
16.6%
CHILD POVERTY UNDER THE AGE OF 5
80.3/ 100
METRIC RATING
147th/ 347
METRIC RANK
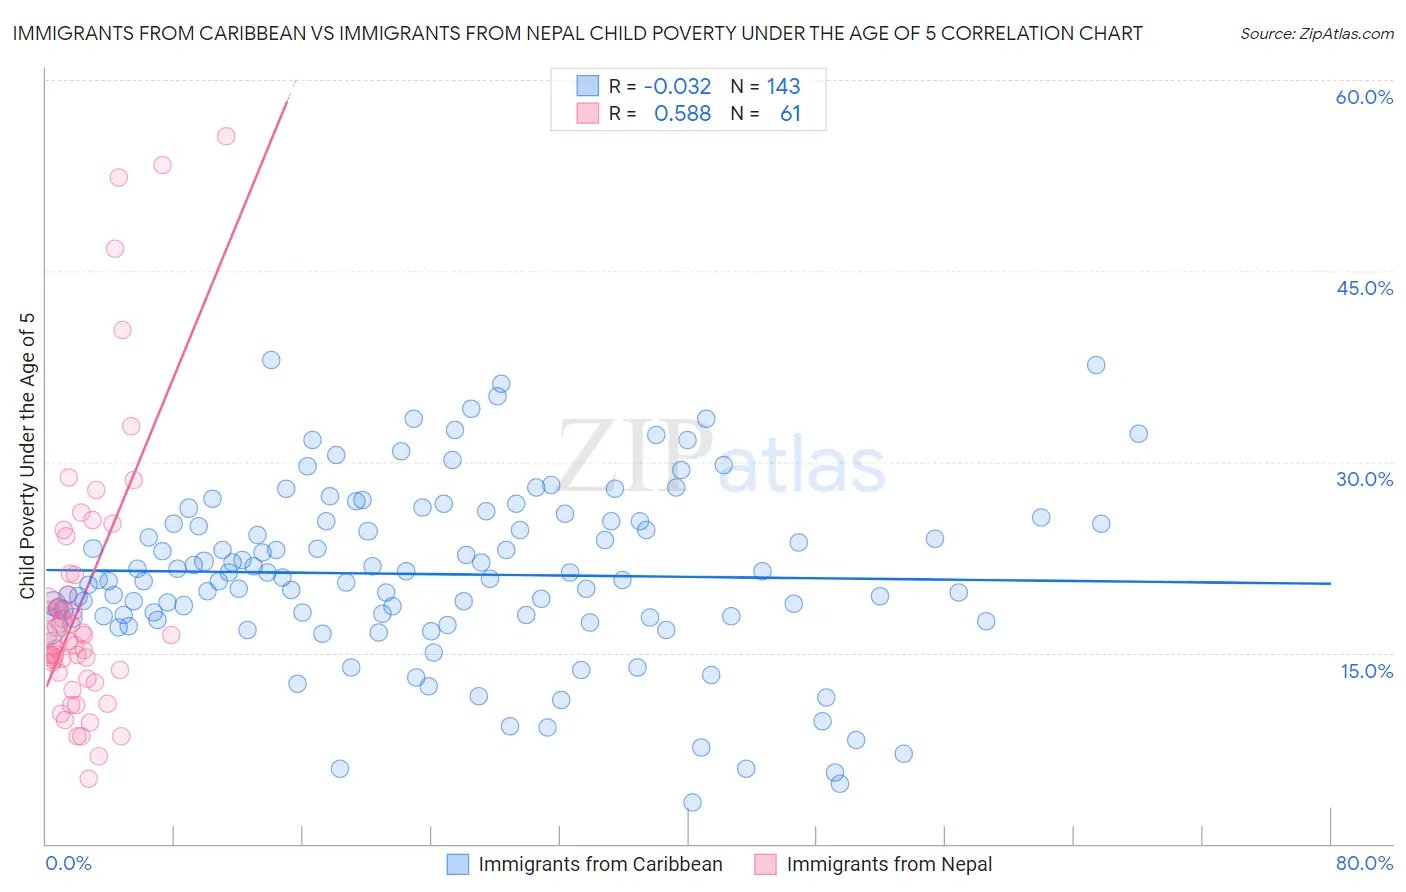
Immigrants from Caribbean vs Immigrants from Nepal Child Poverty Under the Age of 5 Correlation Chart
The statistical analysis conducted on geographies consisting of 429,670,121 people shows no correlation between the proportion of Immigrants from Caribbean and poverty level among children under the age of 5 in the United States with a correlation coefficient (R) of -0.032 and weighted average of 21.4%. Similarly, the statistical analysis conducted on geographies consisting of 183,030,738 people shows a substantial positive correlation between the proportion of Immigrants from Nepal and poverty level among children under the age of 5 in the United States with a correlation coefficient (R) of 0.588 and weighted average of 16.6%, a difference of 28.8%.
Child Poverty Under the Age of 5 Correlation Summary
| Measurement | Immigrants from Caribbean | Immigrants from Nepal |
| Minimum | 3.3% | 5.1% |
| Maximum | 38.0% | 55.6% |
| Range | 34.7% | 50.5% |
| Mean | 21.2% | 19.2% |
| Median | 20.8% | 16.4% |
| Interquartile 25% (IQ1) | 17.8% | 13.5% |
| Interquartile 75% (IQ3) | 25.3% | 21.2% |
| Interquartile Range (IQR) | 7.5% | 7.6% |
| Standard Deviation (Sample) | 6.9% | 10.9% |
| Standard Deviation (Population) | 6.8% | 10.8% |
Similar Demographics by Child Poverty Under the Age of 5
Demographics Similar to Immigrants from Caribbean by Child Poverty Under the Age of 5
In terms of child poverty under the age of 5, the demographic groups most similar to Immigrants from Caribbean are British West Indian (21.4%, a difference of 0.17%), Immigrants from Haiti (21.3%, a difference of 0.41%), Immigrants from Senegal (21.3%, a difference of 0.48%), Immigrants from Zaire (21.3%, a difference of 0.65%), and Immigrants from Latin America (21.2%, a difference of 0.75%).
| Demographics | Rating | Rank | Child Poverty Under the Age of 5 |
| Comanche | 0.0 /100 | #283 | Tragic 21.0% |
| Somalis | 0.0 /100 | #284 | Tragic 21.1% |
| Haitians | 0.0 /100 | #285 | Tragic 21.2% |
| Immigrants | Latin America | 0.0 /100 | #286 | Tragic 21.2% |
| Immigrants | Zaire | 0.0 /100 | #287 | Tragic 21.3% |
| Immigrants | Senegal | 0.0 /100 | #288 | Tragic 21.3% |
| Immigrants | Haiti | 0.0 /100 | #289 | Tragic 21.3% |
| Immigrants | Caribbean | 0.0 /100 | #290 | Tragic 21.4% |
| British West Indians | 0.0 /100 | #291 | Tragic 21.4% |
| Immigrants | Somalia | 0.0 /100 | #292 | Tragic 21.6% |
| Mexicans | 0.0 /100 | #293 | Tragic 21.6% |
| Guatemalans | 0.0 /100 | #294 | Tragic 21.6% |
| Cherokee | 0.0 /100 | #295 | Tragic 21.7% |
| Yaqui | 0.0 /100 | #296 | Tragic 21.7% |
| Hispanics or Latinos | 0.0 /100 | #297 | Tragic 21.7% |
Demographics Similar to Immigrants from Nepal by Child Poverty Under the Age of 5
In terms of child poverty under the age of 5, the demographic groups most similar to Immigrants from Nepal are Syrian (16.6%, a difference of 0.19%), New Zealander (16.6%, a difference of 0.25%), Israeli (16.6%, a difference of 0.31%), Immigrants from Ethiopia (16.6%, a difference of 0.33%), and Colombian (16.7%, a difference of 0.40%).
| Demographics | Rating | Rank | Child Poverty Under the Age of 5 |
| Guamanians/Chamorros | 84.2 /100 | #140 | Excellent 16.5% |
| Immigrants | Western Europe | 83.3 /100 | #141 | Excellent 16.5% |
| Portuguese | 83.0 /100 | #142 | Excellent 16.5% |
| Samoans | 83.0 /100 | #143 | Excellent 16.5% |
| Ethiopians | 82.7 /100 | #144 | Excellent 16.5% |
| Immigrants | Ethiopia | 82.1 /100 | #145 | Excellent 16.6% |
| Israelis | 82.0 /100 | #146 | Excellent 16.6% |
| Immigrants | Nepal | 80.3 /100 | #147 | Excellent 16.6% |
| Syrians | 79.1 /100 | #148 | Good 16.6% |
| New Zealanders | 78.7 /100 | #149 | Good 16.6% |
| Colombians | 77.8 /100 | #150 | Good 16.7% |
| Canadians | 77.6 /100 | #151 | Good 16.7% |
| Belgians | 77.2 /100 | #152 | Good 16.7% |
| Dutch | 77.1 /100 | #153 | Good 16.7% |
| Immigrants | Venezuela | 76.0 /100 | #154 | Good 16.7% |