Immigrants from Bulgaria vs Immigrants from Egypt Married-Couple Family Poverty
COMPARE
Immigrants from Bulgaria
Immigrants from Egypt
Married-Couple Family Poverty
Married-Couple Family Poverty Comparison
Immigrants from Bulgaria
Immigrants from Egypt
4.4%
MARRIED-COUPLE FAMILY POVERTY
99.5/ 100
METRIC RATING
64th/ 347
METRIC RANK
5.0%
MARRIED-COUPLE FAMILY POVERTY
83.4/ 100
METRIC RATING
143rd/ 347
METRIC RANK
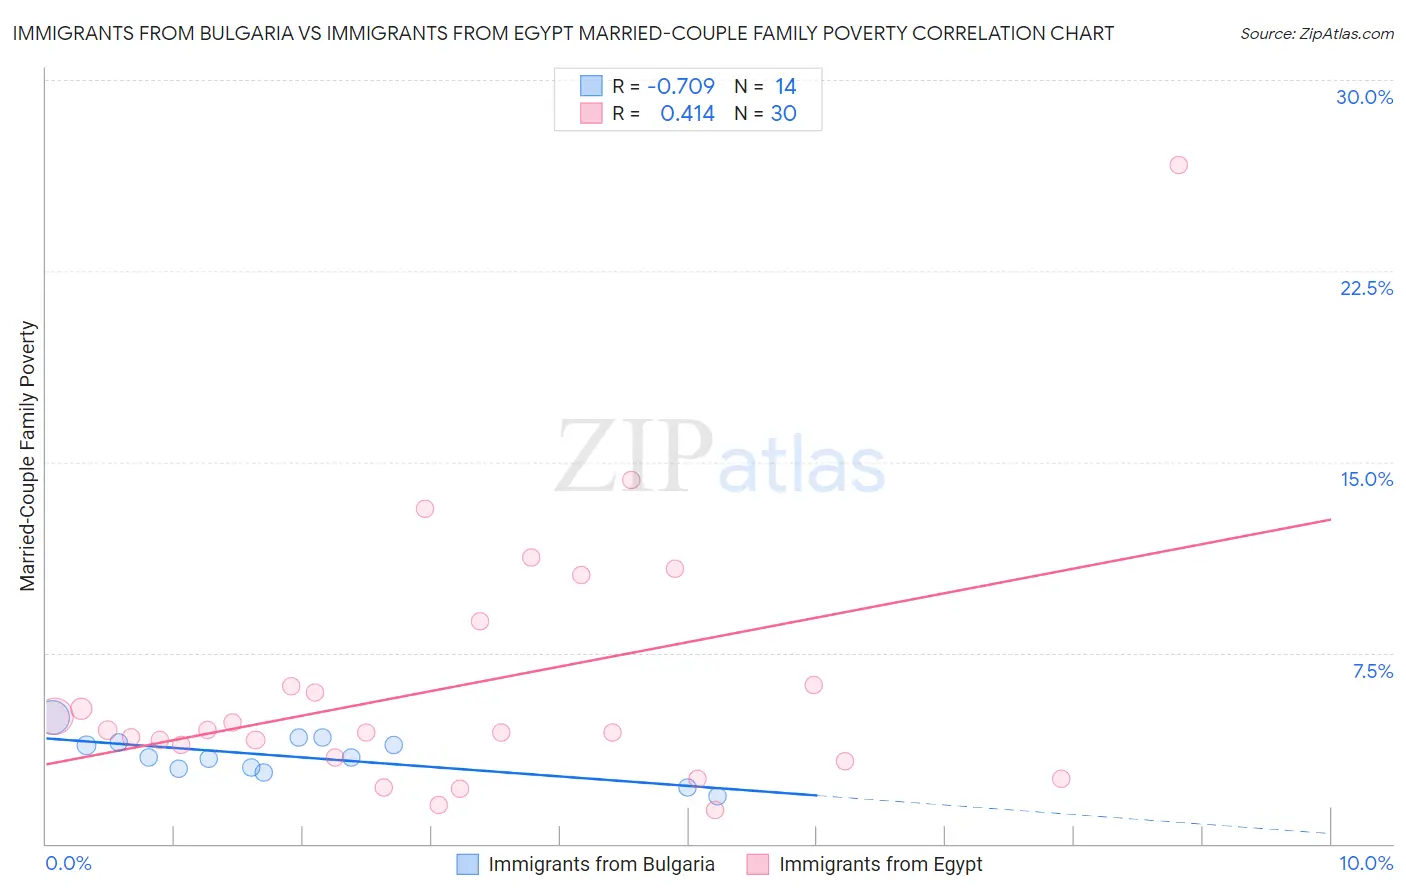
Immigrants from Bulgaria vs Immigrants from Egypt Married-Couple Family Poverty Correlation Chart
The statistical analysis conducted on geographies consisting of 171,925,932 people shows a strong negative correlation between the proportion of Immigrants from Bulgaria and poverty level among married-couple families in the United States with a correlation coefficient (R) of -0.709 and weighted average of 4.4%. Similarly, the statistical analysis conducted on geographies consisting of 244,341,111 people shows a moderate positive correlation between the proportion of Immigrants from Egypt and poverty level among married-couple families in the United States with a correlation coefficient (R) of 0.414 and weighted average of 5.0%, a difference of 12.6%.
Married-Couple Family Poverty Correlation Summary
| Measurement | Immigrants from Bulgaria | Immigrants from Egypt |
| Minimum | 1.9% | 1.3% |
| Maximum | 4.9% | 26.7% |
| Range | 3.1% | 25.4% |
| Mean | 3.4% | 6.2% |
| Median | 3.4% | 4.4% |
| Interquartile 25% (IQ1) | 2.9% | 3.4% |
| Interquartile 75% (IQ3) | 4.0% | 6.3% |
| Interquartile Range (IQR) | 1.1% | 2.9% |
| Standard Deviation (Sample) | 0.83% | 5.1% |
| Standard Deviation (Population) | 0.80% | 5.0% |
Similar Demographics by Married-Couple Family Poverty
Demographics Similar to Immigrants from Bulgaria by Married-Couple Family Poverty
In terms of married-couple family poverty, the demographic groups most similar to Immigrants from Bulgaria are Immigrants from Sri Lanka (4.4%, a difference of 0.41%), Macedonian (4.4%, a difference of 0.47%), Immigrants from Serbia (4.4%, a difference of 0.60%), Immigrants from Canada (4.4%, a difference of 0.65%), and Slavic (4.4%, a difference of 0.66%).
| Demographics | Rating | Rank | Married-Couple Family Poverty |
| Immigrants | Netherlands | 99.7 /100 | #57 | Exceptional 4.3% |
| Czechoslovakians | 99.7 /100 | #58 | Exceptional 4.4% |
| Immigrants | Sweden | 99.6 /100 | #59 | Exceptional 4.4% |
| Tlingit-Haida | 99.6 /100 | #60 | Exceptional 4.4% |
| Okinawans | 99.6 /100 | #61 | Exceptional 4.4% |
| Immigrants | Australia | 99.6 /100 | #62 | Exceptional 4.4% |
| Immigrants | Sri Lanka | 99.6 /100 | #63 | Exceptional 4.4% |
| Immigrants | Bulgaria | 99.5 /100 | #64 | Exceptional 4.4% |
| Macedonians | 99.4 /100 | #65 | Exceptional 4.4% |
| Immigrants | Serbia | 99.4 /100 | #66 | Exceptional 4.4% |
| Immigrants | Canada | 99.4 /100 | #67 | Exceptional 4.4% |
| Slavs | 99.4 /100 | #68 | Exceptional 4.4% |
| New Zealanders | 99.4 /100 | #69 | Exceptional 4.4% |
| Immigrants | Korea | 99.4 /100 | #70 | Exceptional 4.5% |
| Immigrants | North America | 99.3 /100 | #71 | Exceptional 4.5% |
Demographics Similar to Immigrants from Egypt by Married-Couple Family Poverty
In terms of married-couple family poverty, the demographic groups most similar to Immigrants from Egypt are Hmong (5.0%, a difference of 0.050%), Immigrants from Brazil (5.0%, a difference of 0.27%), Immigrants from China (5.0%, a difference of 0.27%), Immigrants from Portugal (5.0%, a difference of 0.32%), and German Russian (5.0%, a difference of 0.38%).
| Demographics | Rating | Rank | Married-Couple Family Poverty |
| Immigrants | Hungary | 88.7 /100 | #136 | Excellent 4.9% |
| Guamanians/Chamorros | 86.5 /100 | #137 | Excellent 4.9% |
| Chileans | 86.0 /100 | #138 | Excellent 4.9% |
| German Russians | 85.1 /100 | #139 | Excellent 5.0% |
| Immigrants | Portugal | 84.8 /100 | #140 | Excellent 5.0% |
| Immigrants | Brazil | 84.6 /100 | #141 | Excellent 5.0% |
| Immigrants | China | 84.6 /100 | #142 | Excellent 5.0% |
| Immigrants | Egypt | 83.4 /100 | #143 | Excellent 5.0% |
| Hmong | 83.2 /100 | #144 | Excellent 5.0% |
| Immigrants | Spain | 79.9 /100 | #145 | Good 5.0% |
| Mongolians | 79.8 /100 | #146 | Good 5.0% |
| Syrians | 78.7 /100 | #147 | Good 5.0% |
| Immigrants | Russia | 78.7 /100 | #148 | Good 5.0% |
| Immigrants | Oceania | 78.6 /100 | #149 | Good 5.0% |
| Brazilians | 78.3 /100 | #150 | Good 5.0% |