Immigrants from Bosnia and Herzegovina vs Immigrants from Spain Female Poverty
COMPARE
Immigrants from Bosnia and Herzegovina
Immigrants from Spain
Female Poverty
Female Poverty Comparison
Immigrants from Bosnia and Herzegovina
Immigrants from Spain
13.2%
FEMALE POVERTY
69.7/ 100
METRIC RATING
156th/ 347
METRIC RANK
13.4%
FEMALE POVERTY
49.9/ 100
METRIC RATING
176th/ 347
METRIC RANK
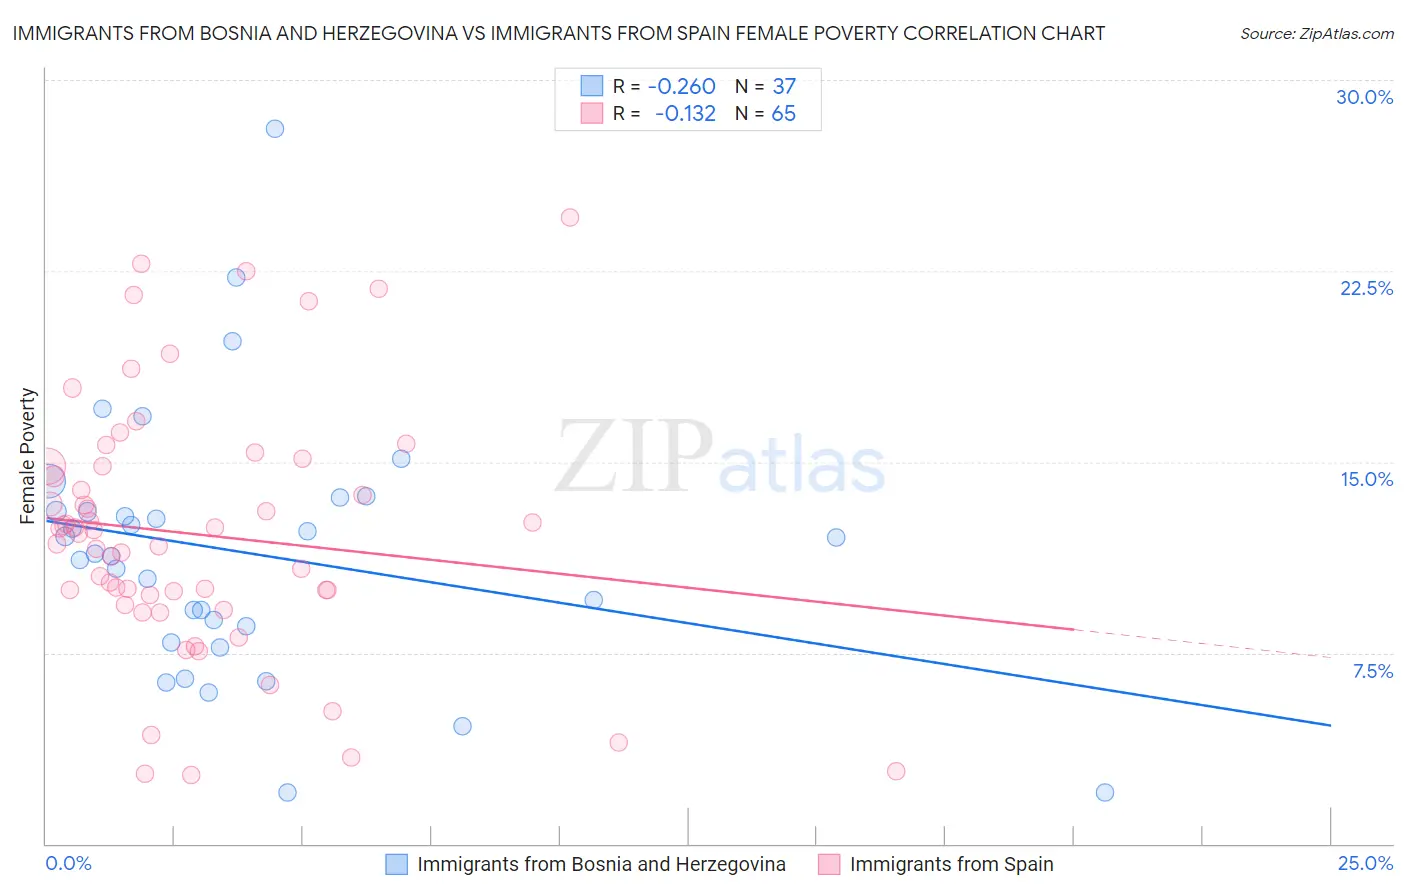
Immigrants from Bosnia and Herzegovina vs Immigrants from Spain Female Poverty Correlation Chart
The statistical analysis conducted on geographies consisting of 156,760,693 people shows a weak negative correlation between the proportion of Immigrants from Bosnia and Herzegovina and poverty level among females in the United States with a correlation coefficient (R) of -0.260 and weighted average of 13.2%. Similarly, the statistical analysis conducted on geographies consisting of 239,582,161 people shows a poor negative correlation between the proportion of Immigrants from Spain and poverty level among females in the United States with a correlation coefficient (R) of -0.132 and weighted average of 13.4%, a difference of 2.1%.
Female Poverty Correlation Summary
| Measurement | Immigrants from Bosnia and Herzegovina | Immigrants from Spain |
| Minimum | 2.0% | 2.7% |
| Maximum | 28.1% | 24.6% |
| Range | 26.1% | 21.9% |
| Mean | 11.4% | 12.1% |
| Median | 11.4% | 12.2% |
| Interquartile 25% (IQ1) | 8.2% | 9.6% |
| Interquartile 75% (IQ3) | 13.3% | 14.8% |
| Interquartile Range (IQR) | 5.1% | 5.3% |
| Standard Deviation (Sample) | 5.2% | 5.0% |
| Standard Deviation (Population) | 5.1% | 4.9% |
Demographics Similar to Immigrants from Bosnia and Herzegovina and Immigrants from Spain by Female Poverty
In terms of female poverty, the demographic groups most similar to Immigrants from Bosnia and Herzegovina are Immigrants from Northern Africa (13.2%, a difference of 0.10%), Pennsylvania German (13.2%, a difference of 0.27%), Costa Rican (13.3%, a difference of 0.68%), Immigrants from Nepal (13.3%, a difference of 0.77%), and Immigrants from Ethiopia (13.3%, a difference of 0.79%). Similarly, the demographic groups most similar to Immigrants from Spain are Celtic (13.4%, a difference of 0.0%), Immigrants from Iraq (13.4%, a difference of 0.010%), Immigrants from Afghanistan (13.4%, a difference of 0.090%), Mongolian (13.4%, a difference of 0.36%), and White/Caucasian (13.4%, a difference of 0.46%).
| Demographics | Rating | Rank | Female Poverty |
| Immigrants | Bosnia and Herzegovina | 69.7 /100 | #156 | Good 13.2% |
| Immigrants | Northern Africa | 68.8 /100 | #157 | Good 13.2% |
| Pennsylvania Germans | 67.3 /100 | #158 | Good 13.2% |
| Costa Ricans | 63.6 /100 | #159 | Good 13.3% |
| Immigrants | Nepal | 62.7 /100 | #160 | Good 13.3% |
| Immigrants | Ethiopia | 62.5 /100 | #161 | Good 13.3% |
| Guamanians/Chamorros | 62.4 /100 | #162 | Good 13.3% |
| Immigrants | Albania | 62.4 /100 | #163 | Good 13.3% |
| Ethiopians | 62.3 /100 | #164 | Good 13.3% |
| Scotch-Irish | 62.1 /100 | #165 | Good 13.3% |
| Immigrants | Oceania | 59.7 /100 | #166 | Average 13.3% |
| Immigrants | Chile | 57.4 /100 | #167 | Average 13.3% |
| Aleuts | 56.7 /100 | #168 | Average 13.4% |
| Lebanese | 55.9 /100 | #169 | Average 13.4% |
| Colombians | 55.7 /100 | #170 | Average 13.4% |
| Whites/Caucasians | 54.6 /100 | #171 | Average 13.4% |
| Mongolians | 53.6 /100 | #172 | Average 13.4% |
| Immigrants | Afghanistan | 50.8 /100 | #173 | Average 13.4% |
| Immigrants | Iraq | 50.0 /100 | #174 | Average 13.4% |
| Celtics | 49.9 /100 | #175 | Average 13.4% |
| Immigrants | Spain | 49.9 /100 | #176 | Average 13.4% |