Immigrants from Bosnia and Herzegovina vs White/Caucasian Child Poverty Among Boys Under 16
COMPARE
Immigrants from Bosnia and Herzegovina
White/Caucasian
Child Poverty Among Boys Under 16
Child Poverty Among Boys Under 16 Comparison
Immigrants from Bosnia and Herzegovina
Whites/Caucasians
16.4%
CHILD POVERTY AMONG BOYS UNDER 16
51.7/ 100
METRIC RATING
170th/ 347
METRIC RANK
16.5%
CHILD POVERTY AMONG BOYS UNDER 16
48.2/ 100
METRIC RATING
176th/ 347
METRIC RANK
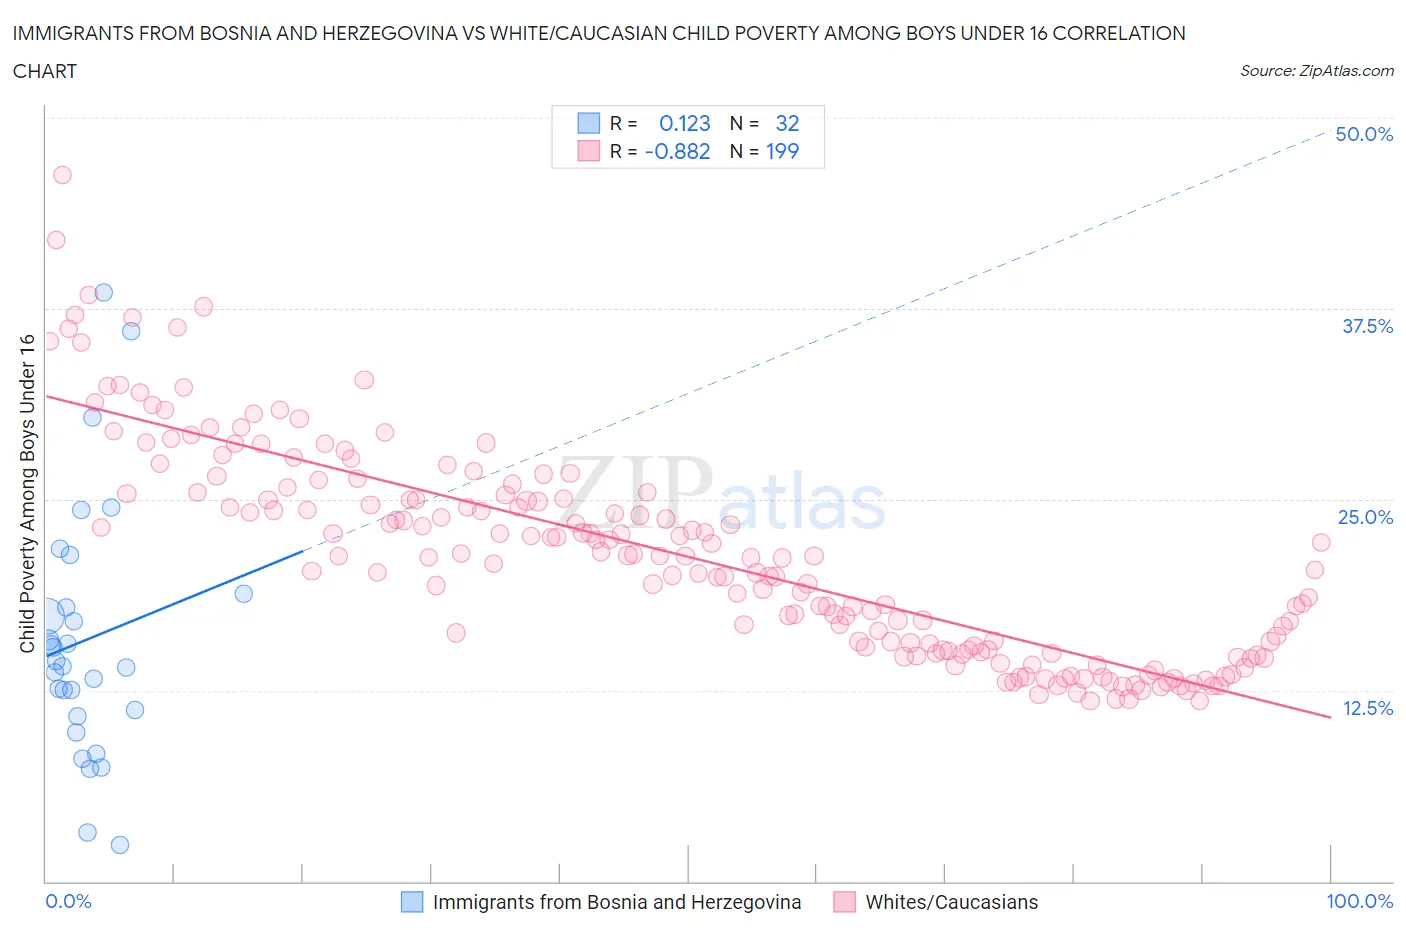
Immigrants from Bosnia and Herzegovina vs White/Caucasian Child Poverty Among Boys Under 16 Correlation Chart
The statistical analysis conducted on geographies consisting of 155,858,187 people shows a poor positive correlation between the proportion of Immigrants from Bosnia and Herzegovina and poverty level among boys under the age of 16 in the United States with a correlation coefficient (R) of 0.123 and weighted average of 16.4%. Similarly, the statistical analysis conducted on geographies consisting of 560,435,427 people shows a very strong negative correlation between the proportion of Whites/Caucasians and poverty level among boys under the age of 16 in the United States with a correlation coefficient (R) of -0.882 and weighted average of 16.5%, a difference of 0.39%.
Child Poverty Among Boys Under 16 Correlation Summary
| Measurement | Immigrants from Bosnia and Herzegovina | White/Caucasian |
| Minimum | 2.4% | 11.8% |
| Maximum | 38.5% | 46.2% |
| Range | 36.2% | 34.4% |
| Mean | 15.8% | 21.3% |
| Median | 14.3% | 21.2% |
| Interquartile 25% (IQ1) | 11.0% | 15.1% |
| Interquartile 75% (IQ3) | 18.4% | 25.3% |
| Interquartile Range (IQR) | 7.4% | 10.2% |
| Standard Deviation (Sample) | 8.2% | 6.9% |
| Standard Deviation (Population) | 8.1% | 6.9% |
Demographics Similar to Immigrants from Bosnia and Herzegovina and Whites/Caucasians by Child Poverty Among Boys Under 16
In terms of child poverty among boys under 16, the demographic groups most similar to Immigrants from Bosnia and Herzegovina are Immigrants from Ethiopia (16.4%, a difference of 0.050%), Immigrants from Colombia (16.4%, a difference of 0.11%), Tsimshian (16.4%, a difference of 0.14%), Uruguayan (16.4%, a difference of 0.19%), and Immigrants from Saudi Arabia (16.4%, a difference of 0.21%). Similarly, the demographic groups most similar to Whites/Caucasians are Ethiopian (16.5%, a difference of 0.040%), Scotch-Irish (16.5%, a difference of 0.080%), Immigrants from Syria (16.5%, a difference of 0.090%), Hungarian (16.5%, a difference of 0.10%), and Uruguayan (16.4%, a difference of 0.20%).
| Demographics | Rating | Rank | Child Poverty Among Boys Under 16 |
| Costa Ricans | 68.1 /100 | #163 | Good 16.1% |
| Immigrants | Albania | 67.9 /100 | #164 | Good 16.1% |
| Colombians | 65.2 /100 | #165 | Good 16.1% |
| Immigrants | Germany | 63.6 /100 | #166 | Good 16.2% |
| Afghans | 55.4 /100 | #167 | Average 16.3% |
| South Americans | 55.3 /100 | #168 | Average 16.3% |
| Immigrants | Saudi Arabia | 53.6 /100 | #169 | Average 16.4% |
| Immigrants | Bosnia and Herzegovina | 51.7 /100 | #170 | Average 16.4% |
| Immigrants | Ethiopia | 51.3 /100 | #171 | Average 16.4% |
| Immigrants | Colombia | 50.8 /100 | #172 | Average 16.4% |
| Tsimshian | 50.5 /100 | #173 | Average 16.4% |
| Uruguayans | 50.0 /100 | #174 | Average 16.4% |
| Immigrants | Syria | 49.0 /100 | #175 | Average 16.5% |
| Whites/Caucasians | 48.2 /100 | #176 | Average 16.5% |
| Ethiopians | 47.8 /100 | #177 | Average 16.5% |
| Scotch-Irish | 47.5 /100 | #178 | Average 16.5% |
| Hungarians | 47.3 /100 | #179 | Average 16.5% |
| Hawaiians | 45.5 /100 | #180 | Average 16.5% |
| South American Indians | 44.3 /100 | #181 | Average 16.5% |
| Lebanese | 43.3 /100 | #182 | Average 16.6% |
| Kenyans | 41.0 /100 | #183 | Average 16.6% |