Inupiat vs Chinese Receiving Food Stamps
COMPARE
Inupiat
Chinese
Receiving Food Stamps
Receiving Food Stamps Comparison
Inupiat
Chinese
20.1%
RECEIVING FOOD STAMPS
0.0/ 100
METRIC RATING
333rd/ 347
METRIC RANK
9.8%
RECEIVING FOOD STAMPS
99.2/ 100
METRIC RATING
63rd/ 347
METRIC RANK
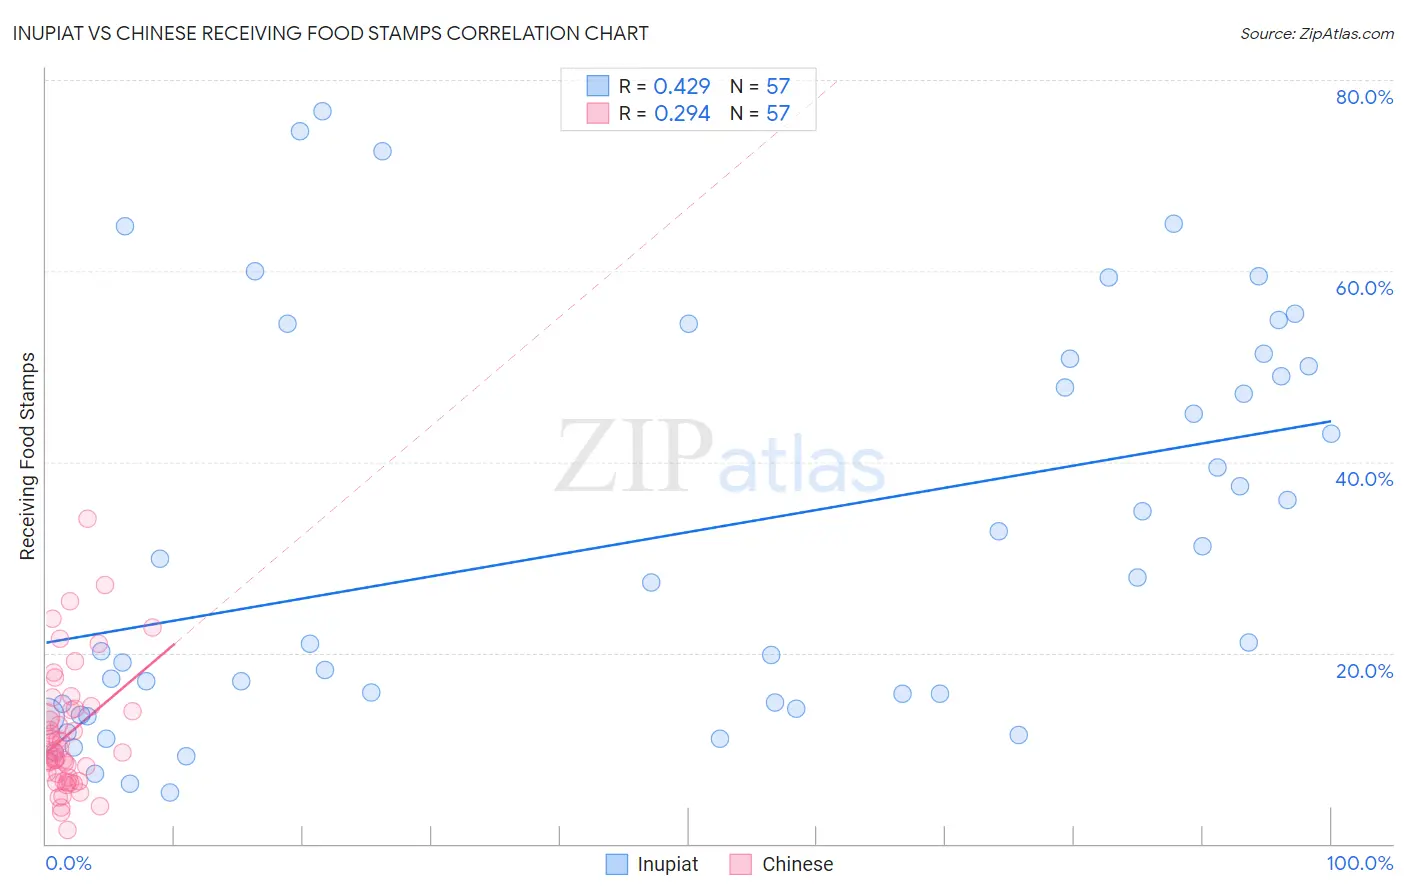
Inupiat vs Chinese Receiving Food Stamps Correlation Chart
The statistical analysis conducted on geographies consisting of 96,290,078 people shows a moderate positive correlation between the proportion of Inupiat and percentage of population receiving government assistance and/or food stamps in the United States with a correlation coefficient (R) of 0.429 and weighted average of 20.1%. Similarly, the statistical analysis conducted on geographies consisting of 64,766,872 people shows a weak positive correlation between the proportion of Chinese and percentage of population receiving government assistance and/or food stamps in the United States with a correlation coefficient (R) of 0.294 and weighted average of 9.8%, a difference of 105.3%.
Receiving Food Stamps Correlation Summary
| Measurement | Inupiat | Chinese |
| Minimum | 5.4% | 1.5% |
| Maximum | 76.7% | 34.0% |
| Range | 71.3% | 32.5% |
| Mean | 32.0% | 11.5% |
| Median | 27.3% | 9.5% |
| Interquartile 25% (IQ1) | 14.4% | 6.8% |
| Interquartile 75% (IQ3) | 50.4% | 14.1% |
| Interquartile Range (IQR) | 36.0% | 7.3% |
| Standard Deviation (Sample) | 20.6% | 6.5% |
| Standard Deviation (Population) | 20.4% | 6.4% |
Similar Demographics by Receiving Food Stamps
Demographics Similar to Inupiat by Receiving Food Stamps
In terms of receiving food stamps, the demographic groups most similar to Inupiat are Pueblo (19.9%, a difference of 0.73%), Yuman (20.2%, a difference of 0.86%), Immigrants from Caribbean (19.6%, a difference of 2.2%), Immigrants from Cuba (20.8%, a difference of 3.8%), and Navajo (21.1%, a difference of 5.0%).
| Demographics | Rating | Rank | Receiving Food Stamps |
| Cubans | 0.0 /100 | #326 | Tragic 18.2% |
| Apache | 0.0 /100 | #327 | Tragic 18.3% |
| Colville | 0.0 /100 | #328 | Tragic 18.3% |
| Immigrants | Dominica | 0.0 /100 | #329 | Tragic 18.4% |
| Pima | 0.0 /100 | #330 | Tragic 19.0% |
| Immigrants | Caribbean | 0.0 /100 | #331 | Tragic 19.6% |
| Pueblo | 0.0 /100 | #332 | Tragic 19.9% |
| Inupiat | 0.0 /100 | #333 | Tragic 20.1% |
| Yuman | 0.0 /100 | #334 | Tragic 20.2% |
| Immigrants | Cuba | 0.0 /100 | #335 | Tragic 20.8% |
| Navajo | 0.0 /100 | #336 | Tragic 21.1% |
| Cape Verdeans | 0.0 /100 | #337 | Tragic 21.1% |
| Dominicans | 0.0 /100 | #338 | Tragic 21.4% |
| Yakama | 0.0 /100 | #339 | Tragic 21.4% |
| Tohono O'odham | 0.0 /100 | #340 | Tragic 21.5% |
Demographics Similar to Chinese by Receiving Food Stamps
In terms of receiving food stamps, the demographic groups most similar to Chinese are Immigrants from Bulgaria (9.8%, a difference of 0.030%), Immigrants from North America (9.8%, a difference of 0.090%), English (9.8%, a difference of 0.11%), German (9.7%, a difference of 0.25%), and Immigrants from Turkey (9.8%, a difference of 0.26%).
| Demographics | Rating | Rank | Receiving Food Stamps |
| Immigrants | Canada | 99.3 /100 | #56 | Exceptional 9.7% |
| Greeks | 99.3 /100 | #57 | Exceptional 9.7% |
| Scandinavians | 99.2 /100 | #58 | Exceptional 9.7% |
| British | 99.2 /100 | #59 | Exceptional 9.7% |
| Germans | 99.2 /100 | #60 | Exceptional 9.7% |
| English | 99.2 /100 | #61 | Exceptional 9.8% |
| Immigrants | Bulgaria | 99.2 /100 | #62 | Exceptional 9.8% |
| Chinese | 99.2 /100 | #63 | Exceptional 9.8% |
| Immigrants | North America | 99.2 /100 | #64 | Exceptional 9.8% |
| Immigrants | Turkey | 99.1 /100 | #65 | Exceptional 9.8% |
| Slovenes | 99.1 /100 | #66 | Exceptional 9.8% |
| Immigrants | Indonesia | 99.0 /100 | #67 | Exceptional 9.8% |
| Northern Europeans | 99.0 /100 | #68 | Exceptional 9.8% |
| Italians | 99.0 /100 | #69 | Exceptional 9.9% |
| Immigrants | Serbia | 99.0 /100 | #70 | Exceptional 9.9% |