Hawaiian vs Immigrants from Oceania Female Poverty
COMPARE
Hawaiian
Immigrants from Oceania
Female Poverty
Female Poverty Comparison
Hawaiians
Immigrants from Oceania
13.6%
FEMALE POVERTY
39.9/ 100
METRIC RATING
188th/ 347
METRIC RANK
13.3%
FEMALE POVERTY
59.7/ 100
METRIC RATING
166th/ 347
METRIC RANK
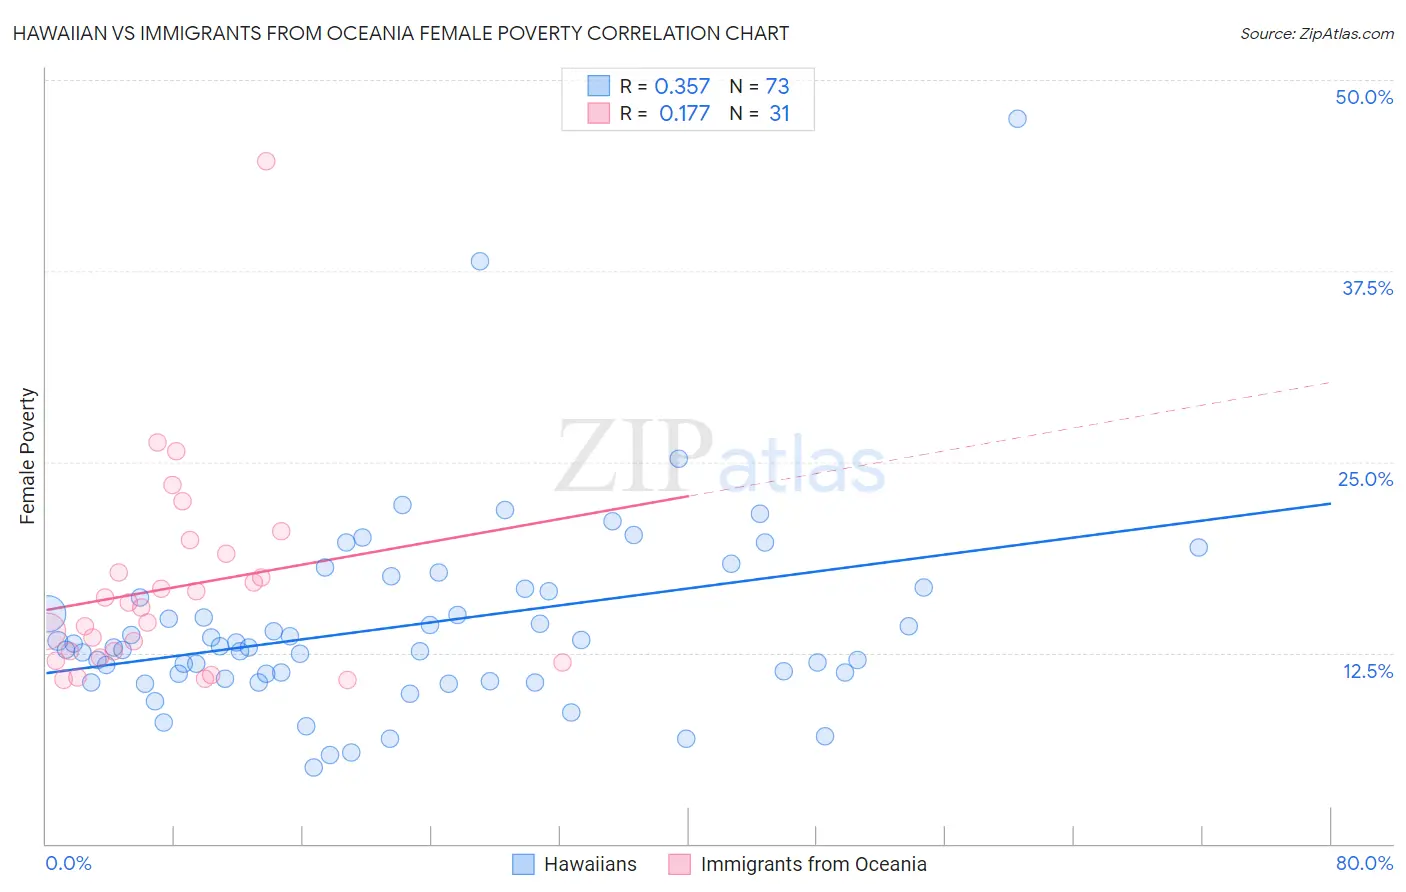
Hawaiian vs Immigrants from Oceania Female Poverty Correlation Chart
The statistical analysis conducted on geographies consisting of 327,347,433 people shows a mild positive correlation between the proportion of Hawaiians and poverty level among females in the United States with a correlation coefficient (R) of 0.357 and weighted average of 13.6%. Similarly, the statistical analysis conducted on geographies consisting of 305,339,012 people shows a poor positive correlation between the proportion of Immigrants from Oceania and poverty level among females in the United States with a correlation coefficient (R) of 0.177 and weighted average of 13.3%, a difference of 2.0%.
Female Poverty Correlation Summary
| Measurement | Hawaiian | Immigrants from Oceania |
| Minimum | 5.0% | 10.7% |
| Maximum | 47.5% | 44.6% |
| Range | 42.5% | 33.9% |
| Mean | 14.3% | 16.8% |
| Median | 12.9% | 15.5% |
| Interquartile 25% (IQ1) | 11.0% | 12.2% |
| Interquartile 75% (IQ3) | 16.6% | 19.0% |
| Interquartile Range (IQR) | 5.7% | 6.8% |
| Standard Deviation (Sample) | 6.5% | 6.8% |
| Standard Deviation (Population) | 6.4% | 6.7% |
Similar Demographics by Female Poverty
Demographics Similar to Hawaiians by Female Poverty
In terms of female poverty, the demographic groups most similar to Hawaiians are Uruguayan (13.6%, a difference of 0.010%), Immigrants from Venezuela (13.6%, a difference of 0.11%), Immigrants from Portugal (13.6%, a difference of 0.16%), Immigrants from Cameroon (13.5%, a difference of 0.21%), and Immigrants from Sierra Leone (13.5%, a difference of 0.32%).
| Demographics | Rating | Rank | Female Poverty |
| Venezuelans | 44.5 /100 | #181 | Average 13.5% |
| Immigrants | Colombia | 44.5 /100 | #182 | Average 13.5% |
| Kenyans | 43.8 /100 | #183 | Average 13.5% |
| Immigrants | Sierra Leone | 43.2 /100 | #184 | Average 13.5% |
| Immigrants | Cameroon | 42.0 /100 | #185 | Average 13.5% |
| Immigrants | Portugal | 41.5 /100 | #186 | Average 13.6% |
| Immigrants | Venezuela | 41.0 /100 | #187 | Average 13.6% |
| Hawaiians | 39.9 /100 | #188 | Fair 13.6% |
| Uruguayans | 39.8 /100 | #189 | Fair 13.6% |
| Sierra Leoneans | 33.1 /100 | #190 | Fair 13.7% |
| Immigrants | Kuwait | 32.7 /100 | #191 | Fair 13.7% |
| Immigrants | Costa Rica | 31.9 /100 | #192 | Fair 13.7% |
| Iraqis | 31.8 /100 | #193 | Fair 13.7% |
| Delaware | 31.1 /100 | #194 | Fair 13.7% |
| Immigrants | South America | 30.6 /100 | #195 | Fair 13.7% |
Demographics Similar to Immigrants from Oceania by Female Poverty
In terms of female poverty, the demographic groups most similar to Immigrants from Oceania are Scotch-Irish (13.3%, a difference of 0.24%), Immigrants from Chile (13.3%, a difference of 0.24%), Ethiopian (13.3%, a difference of 0.26%), Guamanian/Chamorro (13.3%, a difference of 0.27%), and Immigrants from Albania (13.3%, a difference of 0.27%).
| Demographics | Rating | Rank | Female Poverty |
| Costa Ricans | 63.6 /100 | #159 | Good 13.3% |
| Immigrants | Nepal | 62.7 /100 | #160 | Good 13.3% |
| Immigrants | Ethiopia | 62.5 /100 | #161 | Good 13.3% |
| Guamanians/Chamorros | 62.4 /100 | #162 | Good 13.3% |
| Immigrants | Albania | 62.4 /100 | #163 | Good 13.3% |
| Ethiopians | 62.3 /100 | #164 | Good 13.3% |
| Scotch-Irish | 62.1 /100 | #165 | Good 13.3% |
| Immigrants | Oceania | 59.7 /100 | #166 | Average 13.3% |
| Immigrants | Chile | 57.4 /100 | #167 | Average 13.3% |
| Aleuts | 56.7 /100 | #168 | Average 13.4% |
| Lebanese | 55.9 /100 | #169 | Average 13.4% |
| Colombians | 55.7 /100 | #170 | Average 13.4% |
| Whites/Caucasians | 54.6 /100 | #171 | Average 13.4% |
| Mongolians | 53.6 /100 | #172 | Average 13.4% |
| Immigrants | Afghanistan | 50.8 /100 | #173 | Average 13.4% |