Ukrainian vs Immigrants from Oceania Female Poverty
COMPARE
Ukrainian
Immigrants from Oceania
Female Poverty
Female Poverty Comparison
Ukrainians
Immigrants from Oceania
12.2%
FEMALE POVERTY
98.0/ 100
METRIC RATING
63rd/ 347
METRIC RANK
13.3%
FEMALE POVERTY
59.7/ 100
METRIC RATING
166th/ 347
METRIC RANK
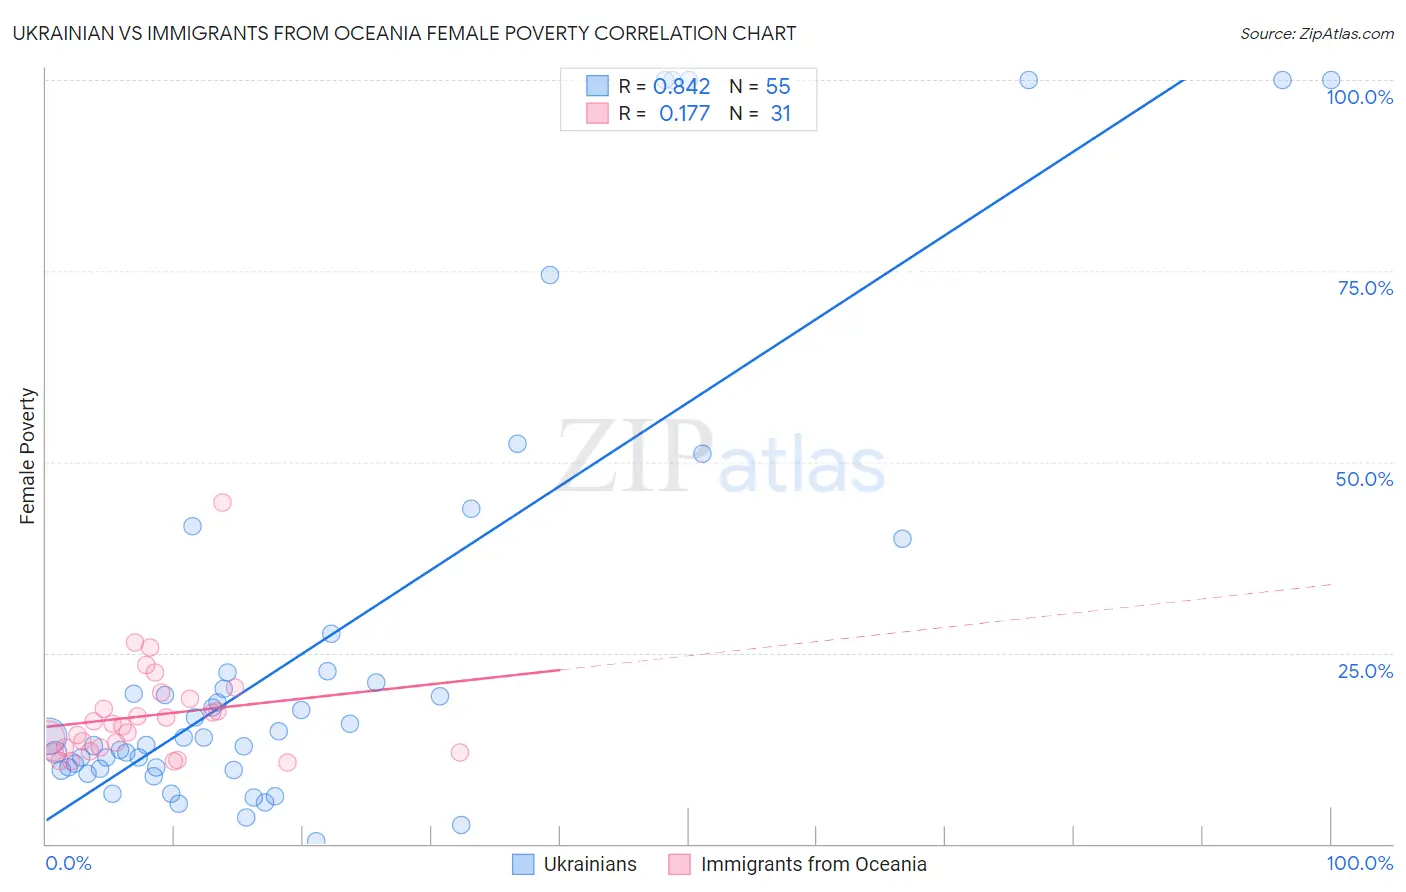
Ukrainian vs Immigrants from Oceania Female Poverty Correlation Chart
The statistical analysis conducted on geographies consisting of 448,134,896 people shows a very strong positive correlation between the proportion of Ukrainians and poverty level among females in the United States with a correlation coefficient (R) of 0.842 and weighted average of 12.2%. Similarly, the statistical analysis conducted on geographies consisting of 305,339,012 people shows a poor positive correlation between the proportion of Immigrants from Oceania and poverty level among females in the United States with a correlation coefficient (R) of 0.177 and weighted average of 13.3%, a difference of 9.3%.
Female Poverty Correlation Summary
| Measurement | Ukrainian | Immigrants from Oceania |
| Minimum | 0.40% | 10.7% |
| Maximum | 100.0% | 44.6% |
| Range | 99.6% | 33.9% |
| Mean | 26.3% | 16.8% |
| Median | 13.9% | 15.5% |
| Interquartile 25% (IQ1) | 9.7% | 12.2% |
| Interquartile 75% (IQ3) | 22.6% | 19.0% |
| Interquartile Range (IQR) | 12.8% | 6.8% |
| Standard Deviation (Sample) | 29.3% | 6.8% |
| Standard Deviation (Population) | 29.1% | 6.7% |
Similar Demographics by Female Poverty
Demographics Similar to Ukrainians by Female Poverty
In terms of female poverty, the demographic groups most similar to Ukrainians are German (12.2%, a difference of 0.030%), Indian (Asian) (12.2%, a difference of 0.060%), Austrian (12.2%, a difference of 0.070%), Immigrants from Italy (12.2%, a difference of 0.080%), and Immigrants from Asia (12.2%, a difference of 0.10%).
| Demographics | Rating | Rank | Female Poverty |
| Estonians | 98.3 /100 | #56 | Exceptional 12.1% |
| Immigrants | Serbia | 98.3 /100 | #57 | Exceptional 12.1% |
| Scandinavians | 98.2 /100 | #58 | Exceptional 12.1% |
| Immigrants | Europe | 98.2 /100 | #59 | Exceptional 12.1% |
| Immigrants | Australia | 98.1 /100 | #60 | Exceptional 12.2% |
| Immigrants | Asia | 98.1 /100 | #61 | Exceptional 12.2% |
| Immigrants | Italy | 98.0 /100 | #62 | Exceptional 12.2% |
| Ukrainians | 98.0 /100 | #63 | Exceptional 12.2% |
| Germans | 98.0 /100 | #64 | Exceptional 12.2% |
| Indians (Asian) | 97.9 /100 | #65 | Exceptional 12.2% |
| Austrians | 97.9 /100 | #66 | Exceptional 12.2% |
| Immigrants | Eastern Asia | 97.8 /100 | #67 | Exceptional 12.2% |
| Immigrants | Netherlands | 97.8 /100 | #68 | Exceptional 12.2% |
| Swiss | 97.7 /100 | #69 | Exceptional 12.2% |
| Immigrants | Belgium | 97.7 /100 | #70 | Exceptional 12.2% |
Demographics Similar to Immigrants from Oceania by Female Poverty
In terms of female poverty, the demographic groups most similar to Immigrants from Oceania are Scotch-Irish (13.3%, a difference of 0.24%), Immigrants from Chile (13.3%, a difference of 0.24%), Ethiopian (13.3%, a difference of 0.26%), Guamanian/Chamorro (13.3%, a difference of 0.27%), and Immigrants from Albania (13.3%, a difference of 0.27%).
| Demographics | Rating | Rank | Female Poverty |
| Costa Ricans | 63.6 /100 | #159 | Good 13.3% |
| Immigrants | Nepal | 62.7 /100 | #160 | Good 13.3% |
| Immigrants | Ethiopia | 62.5 /100 | #161 | Good 13.3% |
| Guamanians/Chamorros | 62.4 /100 | #162 | Good 13.3% |
| Immigrants | Albania | 62.4 /100 | #163 | Good 13.3% |
| Ethiopians | 62.3 /100 | #164 | Good 13.3% |
| Scotch-Irish | 62.1 /100 | #165 | Good 13.3% |
| Immigrants | Oceania | 59.7 /100 | #166 | Average 13.3% |
| Immigrants | Chile | 57.4 /100 | #167 | Average 13.3% |
| Aleuts | 56.7 /100 | #168 | Average 13.4% |
| Lebanese | 55.9 /100 | #169 | Average 13.4% |
| Colombians | 55.7 /100 | #170 | Average 13.4% |
| Whites/Caucasians | 54.6 /100 | #171 | Average 13.4% |
| Mongolians | 53.6 /100 | #172 | Average 13.4% |
| Immigrants | Afghanistan | 50.8 /100 | #173 | Average 13.4% |