Hawaiian vs Immigrants from Grenada Female Poverty
COMPARE
Hawaiian
Immigrants from Grenada
Female Poverty
Female Poverty Comparison
Hawaiians
Immigrants from Grenada
13.6%
FEMALE POVERTY
39.9/ 100
METRIC RATING
188th/ 347
METRIC RANK
16.8%
FEMALE POVERTY
0.0/ 100
METRIC RATING
305th/ 347
METRIC RANK
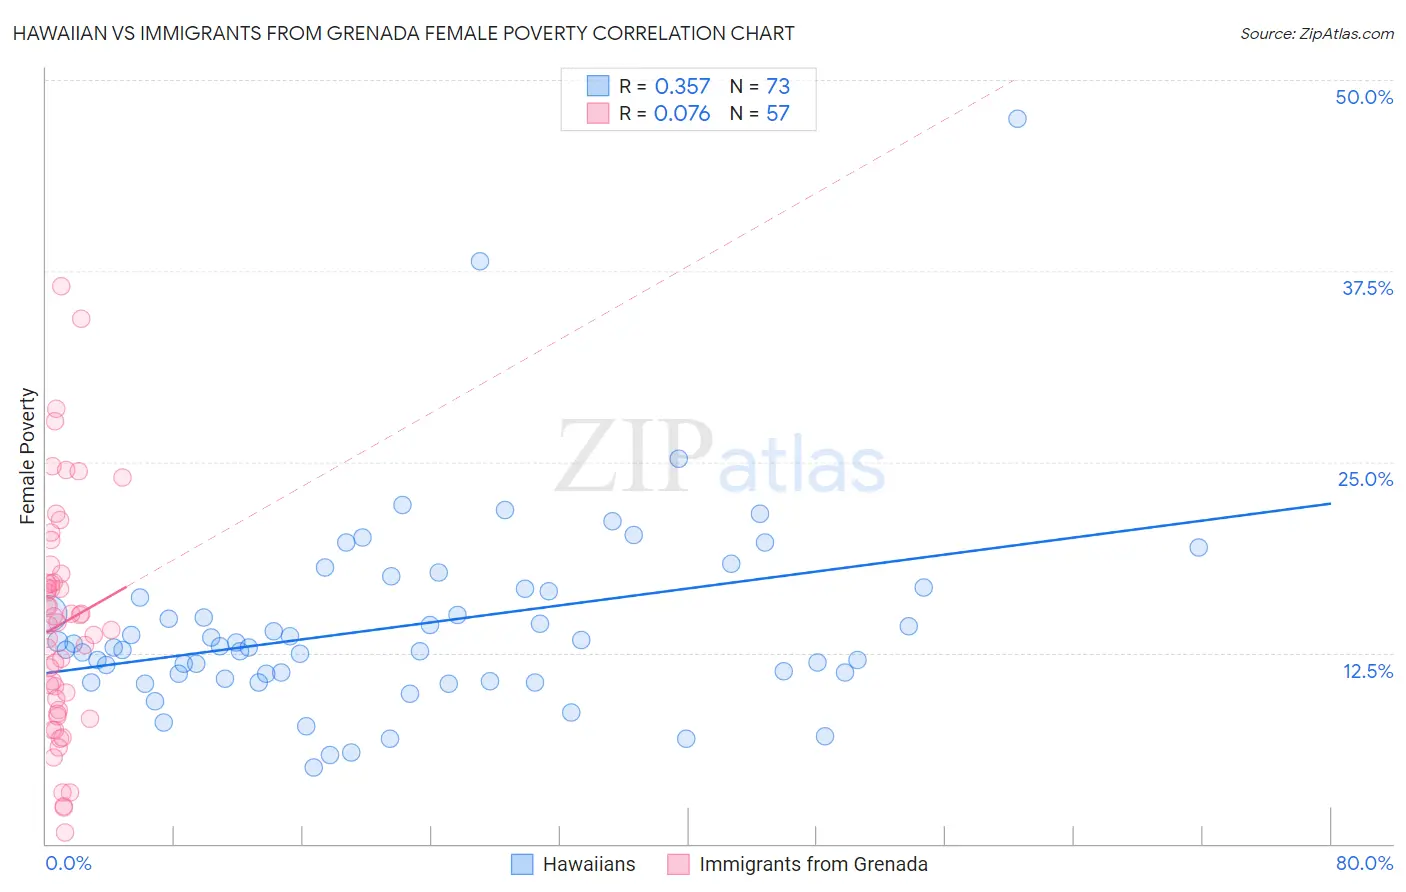
Hawaiian vs Immigrants from Grenada Female Poverty Correlation Chart
The statistical analysis conducted on geographies consisting of 327,347,433 people shows a mild positive correlation between the proportion of Hawaiians and poverty level among females in the United States with a correlation coefficient (R) of 0.357 and weighted average of 13.6%. Similarly, the statistical analysis conducted on geographies consisting of 67,188,736 people shows a slight positive correlation between the proportion of Immigrants from Grenada and poverty level among females in the United States with a correlation coefficient (R) of 0.076 and weighted average of 16.8%, a difference of 23.9%.
Female Poverty Correlation Summary
| Measurement | Hawaiian | Immigrants from Grenada |
| Minimum | 5.0% | 0.74% |
| Maximum | 47.5% | 36.5% |
| Range | 42.5% | 35.8% |
| Mean | 14.3% | 14.4% |
| Median | 12.9% | 14.3% |
| Interquartile 25% (IQ1) | 11.0% | 8.6% |
| Interquartile 75% (IQ3) | 16.6% | 17.4% |
| Interquartile Range (IQR) | 5.7% | 8.8% |
| Standard Deviation (Sample) | 6.5% | 7.6% |
| Standard Deviation (Population) | 6.4% | 7.5% |
Similar Demographics by Female Poverty
Demographics Similar to Hawaiians by Female Poverty
In terms of female poverty, the demographic groups most similar to Hawaiians are Uruguayan (13.6%, a difference of 0.010%), Immigrants from Venezuela (13.6%, a difference of 0.11%), Immigrants from Portugal (13.6%, a difference of 0.16%), Immigrants from Cameroon (13.5%, a difference of 0.21%), and Immigrants from Sierra Leone (13.5%, a difference of 0.32%).
| Demographics | Rating | Rank | Female Poverty |
| Venezuelans | 44.5 /100 | #181 | Average 13.5% |
| Immigrants | Colombia | 44.5 /100 | #182 | Average 13.5% |
| Kenyans | 43.8 /100 | #183 | Average 13.5% |
| Immigrants | Sierra Leone | 43.2 /100 | #184 | Average 13.5% |
| Immigrants | Cameroon | 42.0 /100 | #185 | Average 13.5% |
| Immigrants | Portugal | 41.5 /100 | #186 | Average 13.6% |
| Immigrants | Venezuela | 41.0 /100 | #187 | Average 13.6% |
| Hawaiians | 39.9 /100 | #188 | Fair 13.6% |
| Uruguayans | 39.8 /100 | #189 | Fair 13.6% |
| Sierra Leoneans | 33.1 /100 | #190 | Fair 13.7% |
| Immigrants | Kuwait | 32.7 /100 | #191 | Fair 13.7% |
| Immigrants | Costa Rica | 31.9 /100 | #192 | Fair 13.7% |
| Iraqis | 31.8 /100 | #193 | Fair 13.7% |
| Delaware | 31.1 /100 | #194 | Fair 13.7% |
| Immigrants | South America | 30.6 /100 | #195 | Fair 13.7% |
Demographics Similar to Immigrants from Grenada by Female Poverty
In terms of female poverty, the demographic groups most similar to Immigrants from Grenada are Immigrants from Central America (16.8%, a difference of 0.0%), Choctaw (16.8%, a difference of 0.070%), Immigrants from Caribbean (16.9%, a difference of 0.27%), Seminole (16.9%, a difference of 0.39%), and African (16.9%, a difference of 0.45%).
| Demographics | Rating | Rank | Female Poverty |
| Somalis | 0.0 /100 | #298 | Tragic 16.6% |
| Hispanics or Latinos | 0.0 /100 | #299 | Tragic 16.6% |
| Bahamians | 0.0 /100 | #300 | Tragic 16.6% |
| Guatemalans | 0.0 /100 | #301 | Tragic 16.7% |
| Chippewa | 0.0 /100 | #302 | Tragic 16.7% |
| Choctaw | 0.0 /100 | #303 | Tragic 16.8% |
| Immigrants | Central America | 0.0 /100 | #304 | Tragic 16.8% |
| Immigrants | Grenada | 0.0 /100 | #305 | Tragic 16.8% |
| Immigrants | Caribbean | 0.0 /100 | #306 | Tragic 16.9% |
| Seminole | 0.0 /100 | #307 | Tragic 16.9% |
| Africans | 0.0 /100 | #308 | Tragic 16.9% |
| Immigrants | Mexico | 0.0 /100 | #309 | Tragic 17.0% |
| Creek | 0.0 /100 | #310 | Tragic 17.0% |
| Immigrants | Guatemala | 0.0 /100 | #311 | Tragic 17.0% |
| Immigrants | Somalia | 0.0 /100 | #312 | Tragic 17.0% |