Hawaiian vs Colville Female Poverty
COMPARE
Hawaiian
Colville
Female Poverty
Female Poverty Comparison
Hawaiians
Colville
13.6%
FEMALE POVERTY
39.9/ 100
METRIC RATING
188th/ 347
METRIC RANK
17.8%
FEMALE POVERTY
0.0/ 100
METRIC RATING
325th/ 347
METRIC RANK
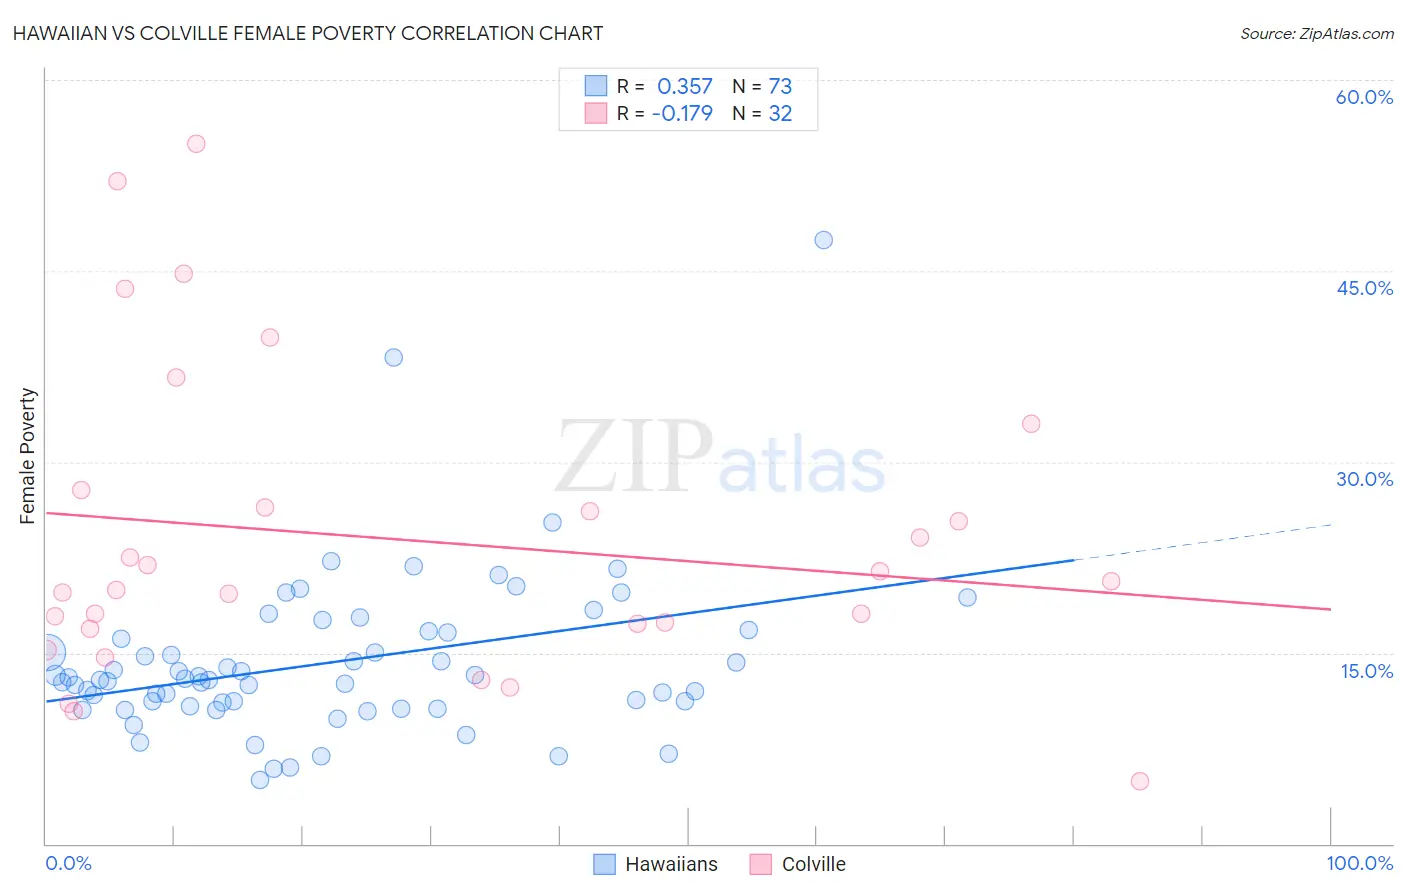
Hawaiian vs Colville Female Poverty Correlation Chart
The statistical analysis conducted on geographies consisting of 327,347,433 people shows a mild positive correlation between the proportion of Hawaiians and poverty level among females in the United States with a correlation coefficient (R) of 0.357 and weighted average of 13.6%. Similarly, the statistical analysis conducted on geographies consisting of 34,683,494 people shows a poor negative correlation between the proportion of Colville and poverty level among females in the United States with a correlation coefficient (R) of -0.179 and weighted average of 17.8%, a difference of 30.8%.
Female Poverty Correlation Summary
| Measurement | Hawaiian | Colville |
| Minimum | 5.0% | 4.9% |
| Maximum | 47.5% | 55.0% |
| Range | 42.5% | 50.1% |
| Mean | 14.3% | 24.0% |
| Median | 12.9% | 20.3% |
| Interquartile 25% (IQ1) | 11.0% | 17.1% |
| Interquartile 75% (IQ3) | 16.6% | 27.1% |
| Interquartile Range (IQR) | 5.7% | 10.0% |
| Standard Deviation (Sample) | 6.5% | 12.1% |
| Standard Deviation (Population) | 6.4% | 11.9% |
Similar Demographics by Female Poverty
Demographics Similar to Hawaiians by Female Poverty
In terms of female poverty, the demographic groups most similar to Hawaiians are Uruguayan (13.6%, a difference of 0.010%), Immigrants from Venezuela (13.6%, a difference of 0.11%), Immigrants from Portugal (13.6%, a difference of 0.16%), Immigrants from Cameroon (13.5%, a difference of 0.21%), and Immigrants from Sierra Leone (13.5%, a difference of 0.32%).
| Demographics | Rating | Rank | Female Poverty |
| Venezuelans | 44.5 /100 | #181 | Average 13.5% |
| Immigrants | Colombia | 44.5 /100 | #182 | Average 13.5% |
| Kenyans | 43.8 /100 | #183 | Average 13.5% |
| Immigrants | Sierra Leone | 43.2 /100 | #184 | Average 13.5% |
| Immigrants | Cameroon | 42.0 /100 | #185 | Average 13.5% |
| Immigrants | Portugal | 41.5 /100 | #186 | Average 13.6% |
| Immigrants | Venezuela | 41.0 /100 | #187 | Average 13.6% |
| Hawaiians | 39.9 /100 | #188 | Fair 13.6% |
| Uruguayans | 39.8 /100 | #189 | Fair 13.6% |
| Sierra Leoneans | 33.1 /100 | #190 | Fair 13.7% |
| Immigrants | Kuwait | 32.7 /100 | #191 | Fair 13.7% |
| Immigrants | Costa Rica | 31.9 /100 | #192 | Fair 13.7% |
| Iraqis | 31.8 /100 | #193 | Fair 13.7% |
| Delaware | 31.1 /100 | #194 | Fair 13.7% |
| Immigrants | South America | 30.6 /100 | #195 | Fair 13.7% |
Demographics Similar to Colville by Female Poverty
In terms of female poverty, the demographic groups most similar to Colville are Immigrants from Honduras (17.7%, a difference of 0.15%), Paiute (17.7%, a difference of 0.34%), Menominee (17.6%, a difference of 0.93%), Central American Indian (18.0%, a difference of 1.5%), and Arapaho (17.5%, a difference of 1.6%).
| Demographics | Rating | Rank | Female Poverty |
| Ute | 0.0 /100 | #318 | Tragic 17.5% |
| Cajuns | 0.0 /100 | #319 | Tragic 17.5% |
| Immigrants | Dominica | 0.0 /100 | #320 | Tragic 17.5% |
| Arapaho | 0.0 /100 | #321 | Tragic 17.5% |
| Menominee | 0.0 /100 | #322 | Tragic 17.6% |
| Paiute | 0.0 /100 | #323 | Tragic 17.7% |
| Immigrants | Honduras | 0.0 /100 | #324 | Tragic 17.7% |
| Colville | 0.0 /100 | #325 | Tragic 17.8% |
| Central American Indians | 0.0 /100 | #326 | Tragic 18.0% |
| Yakama | 0.0 /100 | #327 | Tragic 18.0% |
| Blacks/African Americans | 0.0 /100 | #328 | Tragic 18.6% |
| Kiowa | 0.0 /100 | #329 | Tragic 18.6% |
| Dominicans | 0.0 /100 | #330 | Tragic 19.1% |
| Natives/Alaskans | 0.0 /100 | #331 | Tragic 19.2% |
| Apache | 0.0 /100 | #332 | Tragic 19.2% |