French American Indian vs Subsaharan African Family Poverty
COMPARE
French American Indian
Subsaharan African
Family Poverty
Family Poverty Comparison
French American Indians
Sub-Saharan Africans
10.2%
FAMILY POVERTY
1.5/ 100
METRIC RATING
238th/ 347
METRIC RANK
10.9%
FAMILY POVERTY
0.2/ 100
METRIC RATING
258th/ 347
METRIC RANK
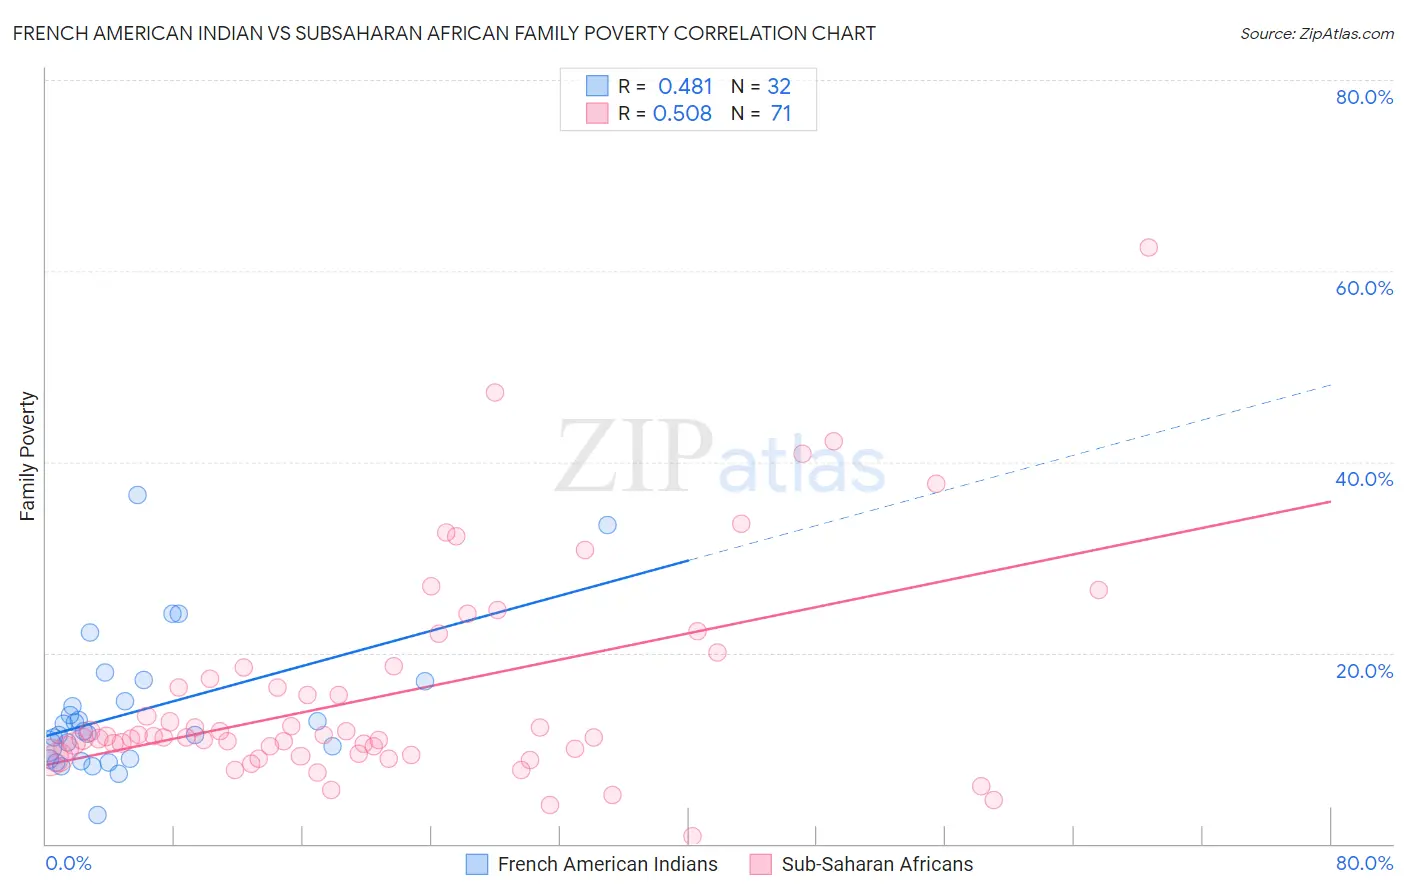
French American Indian vs Subsaharan African Family Poverty Correlation Chart
The statistical analysis conducted on geographies consisting of 131,838,011 people shows a moderate positive correlation between the proportion of French American Indians and poverty level among families in the United States with a correlation coefficient (R) of 0.481 and weighted average of 10.2%. Similarly, the statistical analysis conducted on geographies consisting of 506,098,570 people shows a substantial positive correlation between the proportion of Sub-Saharan Africans and poverty level among families in the United States with a correlation coefficient (R) of 0.508 and weighted average of 10.9%, a difference of 6.0%.
Family Poverty Correlation Summary
| Measurement | French American Indian | Subsaharan African |
| Minimum | 3.0% | 0.78% |
| Maximum | 36.5% | 62.5% |
| Range | 33.5% | 61.7% |
| Mean | 13.9% | 15.6% |
| Median | 11.7% | 11.1% |
| Interquartile 25% (IQ1) | 8.9% | 9.4% |
| Interquartile 75% (IQ3) | 16.0% | 18.4% |
| Interquartile Range (IQR) | 7.1% | 9.0% |
| Standard Deviation (Sample) | 7.3% | 11.1% |
| Standard Deviation (Population) | 7.2% | 11.0% |
Demographics Similar to French American Indians and Sub-Saharan Africans by Family Poverty
In terms of family poverty, the demographic groups most similar to French American Indians are Potawatomi (10.2%, a difference of 0.040%), Immigrants from the Azores (10.3%, a difference of 0.35%), Ghanaian (10.3%, a difference of 0.43%), Alaska Native (10.4%, a difference of 1.3%), and Nepalese (10.4%, a difference of 1.8%). Similarly, the demographic groups most similar to Sub-Saharan Africans are Immigrants from Ghana (10.8%, a difference of 0.030%), Chickasaw (10.8%, a difference of 0.070%), Immigrants from Liberia (10.8%, a difference of 0.34%), Ecuadorian (10.8%, a difference of 0.71%), and Immigrants from Western Africa (10.7%, a difference of 1.0%).
| Demographics | Rating | Rank | Family Poverty |
| French American Indians | 1.5 /100 | #238 | Tragic 10.2% |
| Potawatomi | 1.5 /100 | #239 | Tragic 10.2% |
| Immigrants | Azores | 1.4 /100 | #240 | Tragic 10.3% |
| Ghanaians | 1.3 /100 | #241 | Tragic 10.3% |
| Alaska Natives | 1.0 /100 | #242 | Tragic 10.4% |
| Nepalese | 0.8 /100 | #243 | Tragic 10.4% |
| Cree | 0.7 /100 | #244 | Tragic 10.5% |
| Immigrants | Burma/Myanmar | 0.6 /100 | #245 | Tragic 10.5% |
| Cherokee | 0.5 /100 | #246 | Tragic 10.6% |
| Liberians | 0.4 /100 | #247 | Tragic 10.6% |
| Nicaraguans | 0.4 /100 | #248 | Tragic 10.6% |
| Cubans | 0.4 /100 | #249 | Tragic 10.6% |
| Salvadorans | 0.3 /100 | #250 | Tragic 10.7% |
| Iroquois | 0.3 /100 | #251 | Tragic 10.7% |
| Immigrants | Zaire | 0.3 /100 | #252 | Tragic 10.7% |
| Immigrants | Western Africa | 0.3 /100 | #253 | Tragic 10.7% |
| Ecuadorians | 0.2 /100 | #254 | Tragic 10.8% |
| Immigrants | Liberia | 0.2 /100 | #255 | Tragic 10.8% |
| Chickasaw | 0.2 /100 | #256 | Tragic 10.8% |
| Immigrants | Ghana | 0.2 /100 | #257 | Tragic 10.8% |
| Sub-Saharan Africans | 0.2 /100 | #258 | Tragic 10.9% |