Ecuadorian vs Immigrants from Denmark Male Poverty
COMPARE
Ecuadorian
Immigrants from Denmark
Male Poverty
Male Poverty Comparison
Ecuadorians
Immigrants from Denmark
12.7%
MALE POVERTY
0.4/ 100
METRIC RATING
238th/ 347
METRIC RANK
10.4%
MALE POVERTY
95.0/ 100
METRIC RATING
89th/ 347
METRIC RANK
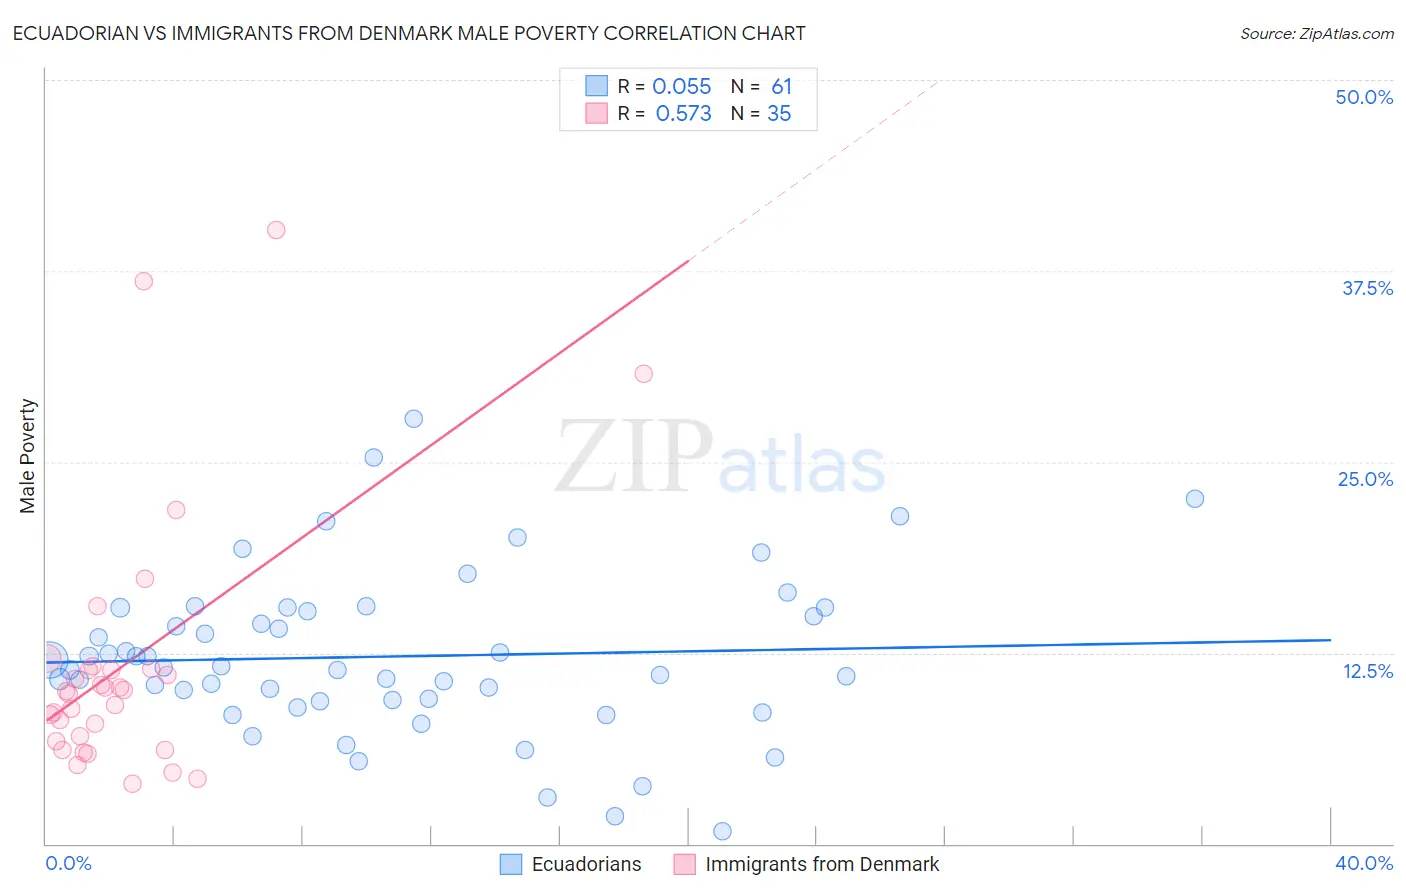
Ecuadorian vs Immigrants from Denmark Male Poverty Correlation Chart
The statistical analysis conducted on geographies consisting of 317,549,368 people shows a slight positive correlation between the proportion of Ecuadorians and poverty level among males in the United States with a correlation coefficient (R) of 0.055 and weighted average of 12.7%. Similarly, the statistical analysis conducted on geographies consisting of 136,389,161 people shows a substantial positive correlation between the proportion of Immigrants from Denmark and poverty level among males in the United States with a correlation coefficient (R) of 0.573 and weighted average of 10.4%, a difference of 22.2%.
Male Poverty Correlation Summary
| Measurement | Ecuadorian | Immigrants from Denmark |
| Minimum | 0.81% | 4.0% |
| Maximum | 27.8% | 40.2% |
| Range | 27.0% | 36.2% |
| Mean | 12.3% | 11.7% |
| Median | 11.6% | 10.0% |
| Interquartile 25% (IQ1) | 9.4% | 6.7% |
| Interquartile 75% (IQ3) | 15.3% | 11.5% |
| Interquartile Range (IQR) | 6.0% | 4.8% |
| Standard Deviation (Sample) | 5.3% | 8.4% |
| Standard Deviation (Population) | 5.3% | 8.3% |
Similar Demographics by Male Poverty
Demographics Similar to Ecuadorians by Male Poverty
In terms of male poverty, the demographic groups most similar to Ecuadorians are Ghanaian (12.7%, a difference of 0.0%), French American Indian (12.7%, a difference of 0.030%), Immigrants from Saudi Arabia (12.7%, a difference of 0.080%), Immigrants from Middle Africa (12.7%, a difference of 0.28%), and Immigrants from Laos (12.6%, a difference of 0.32%).
| Demographics | Rating | Rank | Male Poverty |
| Salvadorans | 0.6 /100 | #231 | Tragic 12.6% |
| Nicaraguans | 0.6 /100 | #232 | Tragic 12.6% |
| Fijians | 0.6 /100 | #233 | Tragic 12.6% |
| Immigrants | Armenia | 0.6 /100 | #234 | Tragic 12.6% |
| Immigrants | Laos | 0.5 /100 | #235 | Tragic 12.6% |
| Immigrants | Saudi Arabia | 0.4 /100 | #236 | Tragic 12.7% |
| French American Indians | 0.4 /100 | #237 | Tragic 12.7% |
| Ecuadorians | 0.4 /100 | #238 | Tragic 12.7% |
| Ghanaians | 0.4 /100 | #239 | Tragic 12.7% |
| Immigrants | Middle Africa | 0.4 /100 | #240 | Tragic 12.7% |
| Sudanese | 0.3 /100 | #241 | Tragic 12.8% |
| Nepalese | 0.3 /100 | #242 | Tragic 12.8% |
| Alaskan Athabascans | 0.3 /100 | #243 | Tragic 12.8% |
| Tsimshian | 0.3 /100 | #244 | Tragic 12.8% |
| Liberians | 0.3 /100 | #245 | Tragic 12.8% |
Demographics Similar to Immigrants from Denmark by Male Poverty
In terms of male poverty, the demographic groups most similar to Immigrants from Denmark are Cambodian (10.4%, a difference of 0.0%), Indian (Asian) (10.4%, a difference of 0.020%), British (10.4%, a difference of 0.090%), Northern European (10.4%, a difference of 0.14%), and Immigrants from Eastern Asia (10.4%, a difference of 0.18%).
| Demographics | Rating | Rank | Male Poverty |
| Egyptians | 95.9 /100 | #82 | Exceptional 10.3% |
| Immigrants | Sweden | 95.7 /100 | #83 | Exceptional 10.3% |
| Czechoslovakians | 95.6 /100 | #84 | Exceptional 10.3% |
| Immigrants | England | 95.5 /100 | #85 | Exceptional 10.4% |
| Immigrants | Eastern Asia | 95.3 /100 | #86 | Exceptional 10.4% |
| Northern Europeans | 95.2 /100 | #87 | Exceptional 10.4% |
| Cambodians | 95.0 /100 | #88 | Exceptional 10.4% |
| Immigrants | Denmark | 95.0 /100 | #89 | Exceptional 10.4% |
| Indians (Asian) | 94.9 /100 | #90 | Exceptional 10.4% |
| British | 94.8 /100 | #91 | Exceptional 10.4% |
| Jordanians | 94.4 /100 | #92 | Exceptional 10.4% |
| Australians | 94.4 /100 | #93 | Exceptional 10.4% |
| Immigrants | South Africa | 94.1 /100 | #94 | Exceptional 10.4% |
| Scottish | 94.0 /100 | #95 | Exceptional 10.4% |
| Immigrants | Egypt | 93.7 /100 | #96 | Exceptional 10.4% |