Ecuadorian vs Mongolian Male Poverty
COMPARE
Ecuadorian
Mongolian
Male Poverty
Male Poverty Comparison
Ecuadorians
Mongolians
12.7%
MALE POVERTY
0.4/ 100
METRIC RATING
238th/ 347
METRIC RANK
11.3%
MALE POVERTY
39.0/ 100
METRIC RATING
182nd/ 347
METRIC RANK
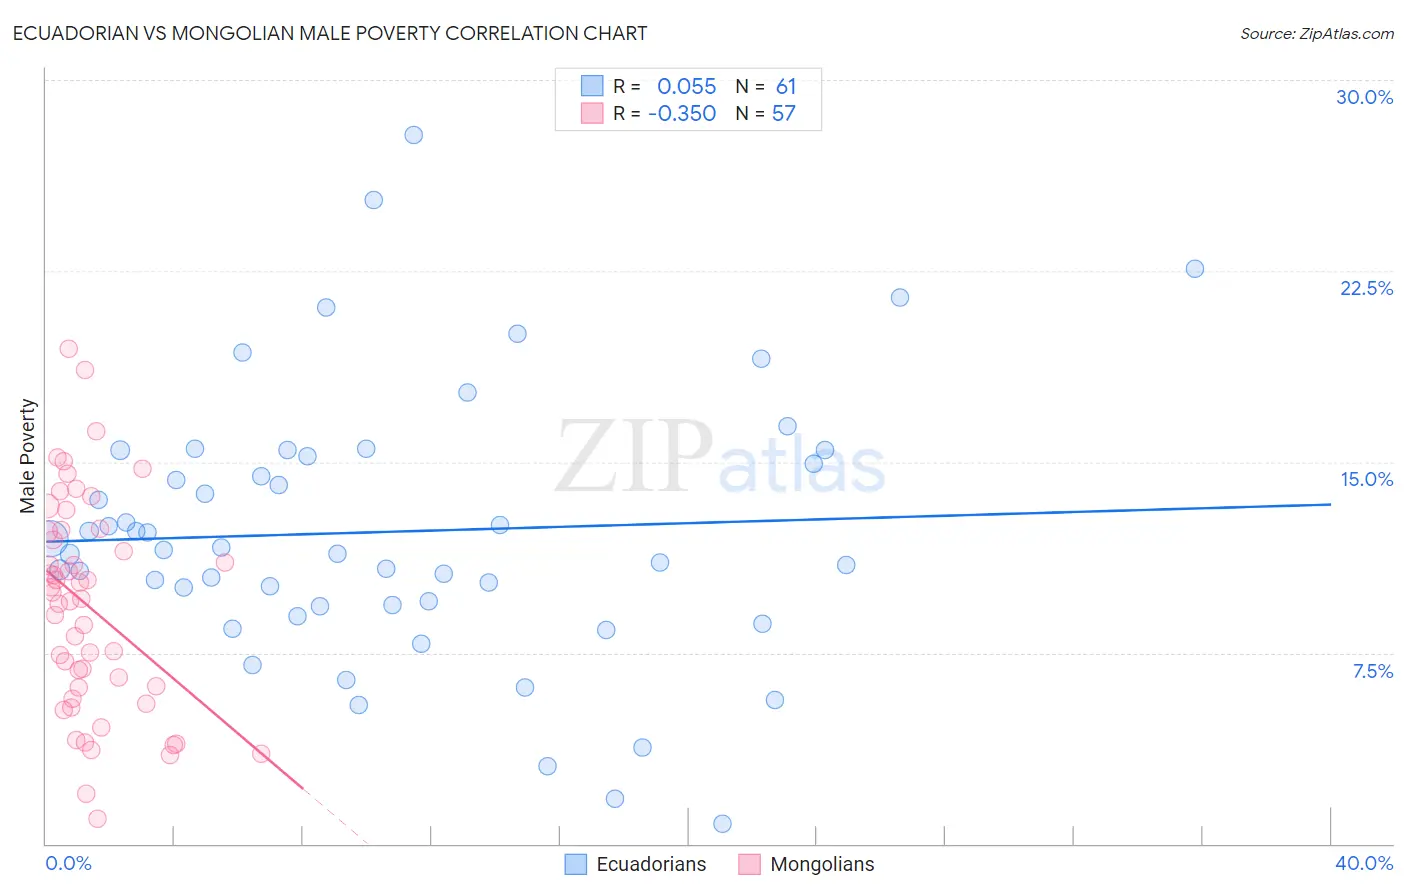
Ecuadorian vs Mongolian Male Poverty Correlation Chart
The statistical analysis conducted on geographies consisting of 317,549,368 people shows a slight positive correlation between the proportion of Ecuadorians and poverty level among males in the United States with a correlation coefficient (R) of 0.055 and weighted average of 12.7%. Similarly, the statistical analysis conducted on geographies consisting of 140,285,777 people shows a mild negative correlation between the proportion of Mongolians and poverty level among males in the United States with a correlation coefficient (R) of -0.350 and weighted average of 11.3%, a difference of 12.1%.
Male Poverty Correlation Summary
| Measurement | Ecuadorian | Mongolian |
| Minimum | 0.81% | 0.97% |
| Maximum | 27.8% | 19.4% |
| Range | 27.0% | 18.5% |
| Mean | 12.3% | 9.3% |
| Median | 11.6% | 9.6% |
| Interquartile 25% (IQ1) | 9.4% | 5.9% |
| Interquartile 75% (IQ3) | 15.3% | 12.3% |
| Interquartile Range (IQR) | 6.0% | 6.4% |
| Standard Deviation (Sample) | 5.3% | 4.2% |
| Standard Deviation (Population) | 5.3% | 4.2% |
Similar Demographics by Male Poverty
Demographics Similar to Ecuadorians by Male Poverty
In terms of male poverty, the demographic groups most similar to Ecuadorians are Ghanaian (12.7%, a difference of 0.0%), French American Indian (12.7%, a difference of 0.030%), Immigrants from Saudi Arabia (12.7%, a difference of 0.080%), Immigrants from Middle Africa (12.7%, a difference of 0.28%), and Immigrants from Laos (12.6%, a difference of 0.32%).
| Demographics | Rating | Rank | Male Poverty |
| Salvadorans | 0.6 /100 | #231 | Tragic 12.6% |
| Nicaraguans | 0.6 /100 | #232 | Tragic 12.6% |
| Fijians | 0.6 /100 | #233 | Tragic 12.6% |
| Immigrants | Armenia | 0.6 /100 | #234 | Tragic 12.6% |
| Immigrants | Laos | 0.5 /100 | #235 | Tragic 12.6% |
| Immigrants | Saudi Arabia | 0.4 /100 | #236 | Tragic 12.7% |
| French American Indians | 0.4 /100 | #237 | Tragic 12.7% |
| Ecuadorians | 0.4 /100 | #238 | Tragic 12.7% |
| Ghanaians | 0.4 /100 | #239 | Tragic 12.7% |
| Immigrants | Middle Africa | 0.4 /100 | #240 | Tragic 12.7% |
| Sudanese | 0.3 /100 | #241 | Tragic 12.8% |
| Nepalese | 0.3 /100 | #242 | Tragic 12.8% |
| Alaskan Athabascans | 0.3 /100 | #243 | Tragic 12.8% |
| Tsimshian | 0.3 /100 | #244 | Tragic 12.8% |
| Liberians | 0.3 /100 | #245 | Tragic 12.8% |
Demographics Similar to Mongolians by Male Poverty
In terms of male poverty, the demographic groups most similar to Mongolians are Immigrants from Costa Rica (11.3%, a difference of 0.050%), Kenyan (11.3%, a difference of 0.060%), Immigrants from Morocco (11.3%, a difference of 0.11%), Immigrants from Syria (11.3%, a difference of 0.13%), and Immigrants from South America (11.3%, a difference of 0.22%).
| Demographics | Rating | Rank | Male Poverty |
| Celtics | 47.5 /100 | #175 | Average 11.2% |
| Immigrants | Fiji | 46.0 /100 | #176 | Average 11.2% |
| Lebanese | 45.6 /100 | #177 | Average 11.2% |
| Immigrants | Cameroon | 44.5 /100 | #178 | Average 11.2% |
| Immigrants | Syria | 40.3 /100 | #179 | Average 11.3% |
| Immigrants | Morocco | 40.1 /100 | #180 | Average 11.3% |
| Immigrants | Costa Rica | 39.5 /100 | #181 | Fair 11.3% |
| Mongolians | 39.0 /100 | #182 | Fair 11.3% |
| Kenyans | 38.4 /100 | #183 | Fair 11.3% |
| Immigrants | South America | 36.9 /100 | #184 | Fair 11.3% |
| Immigrants | Afghanistan | 33.3 /100 | #185 | Fair 11.4% |
| Immigrants | Sierra Leone | 32.9 /100 | #186 | Fair 11.4% |
| Immigrants | Iraq | 31.9 /100 | #187 | Fair 11.4% |
| Sierra Leoneans | 29.9 /100 | #188 | Fair 11.4% |
| Hawaiians | 28.3 /100 | #189 | Fair 11.4% |