Immigrants from Australia vs Immigrants from Denmark Male Poverty

COMPARE

Immigrants from Australia
Race
Ancestry
AfghanAfricanAlaska NativeAlaskan AthabascanAlbanianAleutAlsatianAmericanApacheArabArapahoArgentineanArmenianAssyrian/Chaldean/SyriacAustralianAustrianBahamianBangladeshiBarbadianBasqueBelgianBelizeanBermudanBhutaneseBlackfeetBolivianBrazilianBritishBritish West IndianBulgarianBurmeseCajunCambodianCanadianCape VerdeanCarpatho RusynCelticCentral AmericanCentral American IndianCherokeeCheyenneChickasawChileanChineseChippewaChoctawColombianColvilleComancheCosta RicanCreeCreekCroatianCrowCubanCypriotCzechCzechoslovakianDanishDelawareDominicanDutchDutch West IndianEastern EuropeanEcuadorianEgyptianEnglishEstonianEthiopianEuropeanFijianFilipinoFinnishFrenchFrench American IndianFrench CanadianGermanGerman RussianGhanaianGreekGuamanian/ChamorroGuatemalanGuyaneseHaitianHmongHonduranHopiHoumaHungarianIcelanderIndian (Asian)IndonesianInupiatIranianIraqiIrishIroquoisIsraeliItalianJamaicanJapaneseJordanianKenyanKiowaKoreanLaotianLatvianLebaneseLiberianLithuanianLumbeeLuxembourgerMacedonianMalaysianMalteseMarshalleseMenomineeMexicanMexican American IndianMongolianMoroccanNative HawaiianNavajoNepaleseNew ZealanderNicaraguanNigerianNorthern EuropeanNorwegianOkinawanOsageOttawaPaiutePakistaniPalestinianPanamanianParaguayanPennsylvania GermanPeruvianPimaPolishPortuguesePotawatomiPuebloPuerto RicanPuget Sound SalishRomanianRussianSalvadoranSamoanScandinavianScotch-IrishScottishSeminoleSenegaleseSerbianShoshoneSierra LeoneanSiouxSlavicSlovakSloveneSomaliSouth AfricanSouth AmericanSouth American IndianSoviet UnionSpaniardSpanishSpanish AmericanSpanish American IndianSri LankanSubsaharan AfricanSudaneseSwedishSwissSyrianTaiwaneseThaiTlingit-HaidaTohono O'OdhamTonganTrinidadian and TobagonianTsimshianTurkishU.S. Virgin IslanderUgandanUkrainianUruguayanUteVenezuelanVietnameseWelshWest IndianYakamaYaquiYugoslavianYumanYup'ikZimbabwean
Immigration
NonimmigrantsImmigrantsAfghanistanAfricaAlbaniaArgentinaArmeniaAsiaAustraliaAustriaBahamasBangladeshBarbadosBelarusBelgiumBelizeBoliviaBosnia and HerzegovinaBrazilBulgariaBurma/MyanmarCabo VerdeCambodiaCameroonCanadaCaribbeanCentral AmericaChileChinaColombiaCongoCosta RicaCroatiaCubaCzechoslovakiaDominicaDominican RepublicEastern AfricaEastern AsiaEastern EuropeEcuadorEgyptEl SalvadorEnglandEritreaEthiopiaEuropeFijiFranceGermanyGhanaGreeceGrenadaGuatemalaGuyanaHaitiHondurasHong KongHungaryIndiaIndonesiaIranIraqIrelandIsraelItalyJamaicaJapanJordanKazakhstanKenyaKoreaKuwaitLaosLatin AmericaLatviaLebanonLiberiaLithuaniaMalaysiaMexicoMicronesiaMiddle AfricaMoldovaMoroccoNepalNetherlandsNicaraguaNigeriaNorth AmericaNorth MacedoniaNorthern AfricaNorthern EuropeNorwayOceaniaPakistanPanamaPeruPhilippinesPolandPortugalRomaniaRussiaSaudi ArabiaScotlandSenegalSerbiaSierra LeoneSingaporeSomaliaSouth AfricaSouth AmericaSouth Central AsiaSouth Eastern AsiaSouthern EuropeSpainSri LankaSt. Vincent and the GrenadinesSudanSwedenSwitzerlandSyriaTaiwanThailandTrinidad and TobagoTurkeyUgandaUkraineUruguayUzbekistanVenezuelaVietnamWest IndiesWestern AfricaWestern AsiaWestern EuropeYemenZaireZimbabweAzores
Immigrants from Denmark
Race
Ancestry
AfghanAfricanAlaska NativeAlaskan AthabascanAlbanianAleutAlsatianAmericanApacheArabArapahoArgentineanArmenianAssyrian/Chaldean/SyriacAustralianAustrianBahamianBangladeshiBarbadianBasqueBelgianBelizeanBermudanBhutaneseBlackfeetBolivianBrazilianBritishBritish West IndianBulgarianBurmeseCajunCambodianCanadianCape VerdeanCarpatho RusynCelticCentral AmericanCentral American IndianCherokeeCheyenneChickasawChileanChineseChippewaChoctawColombianColvilleComancheCosta RicanCreeCreekCroatianCrowCubanCypriotCzechCzechoslovakianDanishDelawareDominicanDutchDutch West IndianEastern EuropeanEcuadorianEgyptianEnglishEstonianEthiopianEuropeanFijianFilipinoFinnishFrenchFrench American IndianFrench CanadianGermanGerman RussianGhanaianGreekGuamanian/ChamorroGuatemalanGuyaneseHaitianHmongHonduranHopiHoumaHungarianIcelanderIndian (Asian)IndonesianInupiatIranianIraqiIrishIroquoisIsraeliItalianJamaicanJapaneseJordanianKenyanKiowaKoreanLaotianLatvianLebaneseLiberianLithuanianLumbeeLuxembourgerMacedonianMalaysianMalteseMarshalleseMenomineeMexicanMexican American IndianMongolianMoroccanNative HawaiianNavajoNepaleseNew ZealanderNicaraguanNigerianNorthern EuropeanNorwegianOkinawanOsageOttawaPaiutePakistaniPalestinianPanamanianParaguayanPennsylvania GermanPeruvianPimaPolishPortuguesePotawatomiPuebloPuerto RicanPuget Sound SalishRomanianRussianSalvadoranSamoanScandinavianScotch-IrishScottishSeminoleSenegaleseSerbianShoshoneSierra LeoneanSiouxSlavicSlovakSloveneSomaliSouth AfricanSouth AmericanSouth American IndianSoviet UnionSpaniardSpanishSpanish AmericanSpanish American IndianSri LankanSubsaharan AfricanSudaneseSwedishSwissSyrianTaiwaneseThaiTlingit-HaidaTohono O'OdhamTonganTrinidadian and TobagonianTsimshianTurkishU.S. Virgin IslanderUgandanUkrainianUruguayanUteVenezuelanVietnameseWelshWest IndianYakamaYaquiYugoslavianYumanYup'ikZimbabwean
Immigration
NonimmigrantsImmigrantsAfghanistanAfricaAlbaniaArgentinaArmeniaAsiaAustriaBahamasBangladeshBarbadosBelarusBelgiumBelizeBoliviaBosnia and HerzegovinaBrazilBulgariaBurma/MyanmarCabo VerdeCambodiaCameroonCanadaCaribbeanCentral AmericaChileChinaColombiaCongoCosta RicaCroatiaCubaCzechoslovakiaDenmarkDominicaDominican RepublicEastern AfricaEastern AsiaEastern EuropeEcuadorEgyptEl SalvadorEnglandEritreaEthiopiaEuropeFijiFranceGermanyGhanaGreeceGrenadaGuatemalaGuyanaHaitiHondurasHong KongHungaryIndiaIndonesiaIranIraqIrelandIsraelItalyJamaicaJapanJordanKazakhstanKenyaKoreaKuwaitLaosLatin AmericaLatviaLebanonLiberiaLithuaniaMalaysiaMexicoMicronesiaMiddle AfricaMoldovaMoroccoNepalNetherlandsNicaraguaNigeriaNorth AmericaNorth MacedoniaNorthern AfricaNorthern EuropeNorwayOceaniaPakistanPanamaPeruPhilippinesPolandPortugalRomaniaRussiaSaudi ArabiaScotlandSenegalSerbiaSierra LeoneSingaporeSomaliaSouth AfricaSouth AmericaSouth Central AsiaSouth Eastern AsiaSouthern EuropeSpainSri LankaSt. Vincent and the GrenadinesSudanSwedenSwitzerlandSyriaTaiwanThailandTrinidad and TobagoTurkeyUgandaUkraineUruguayUzbekistanVenezuelaVietnamWest IndiesWestern AfricaWestern AsiaWestern EuropeYemenZaireZimbabweAzores
Male Poverty
Income
Poverty
Unemployment
Labor Participation
Family Structure
Vehicle Availability
Education Level
Disability

Male Poverty Comparison

Immigrants from Australia

Immigrants from Denmark

Exceptional
Exceptional
10.2%
MALE POVERTY
97.1/ 100
METRIC RATING
69th/ 347
METRIC RANK
10.4%
MALE POVERTY
95.0/ 100
METRIC RATING
89th/ 347
METRIC RANK

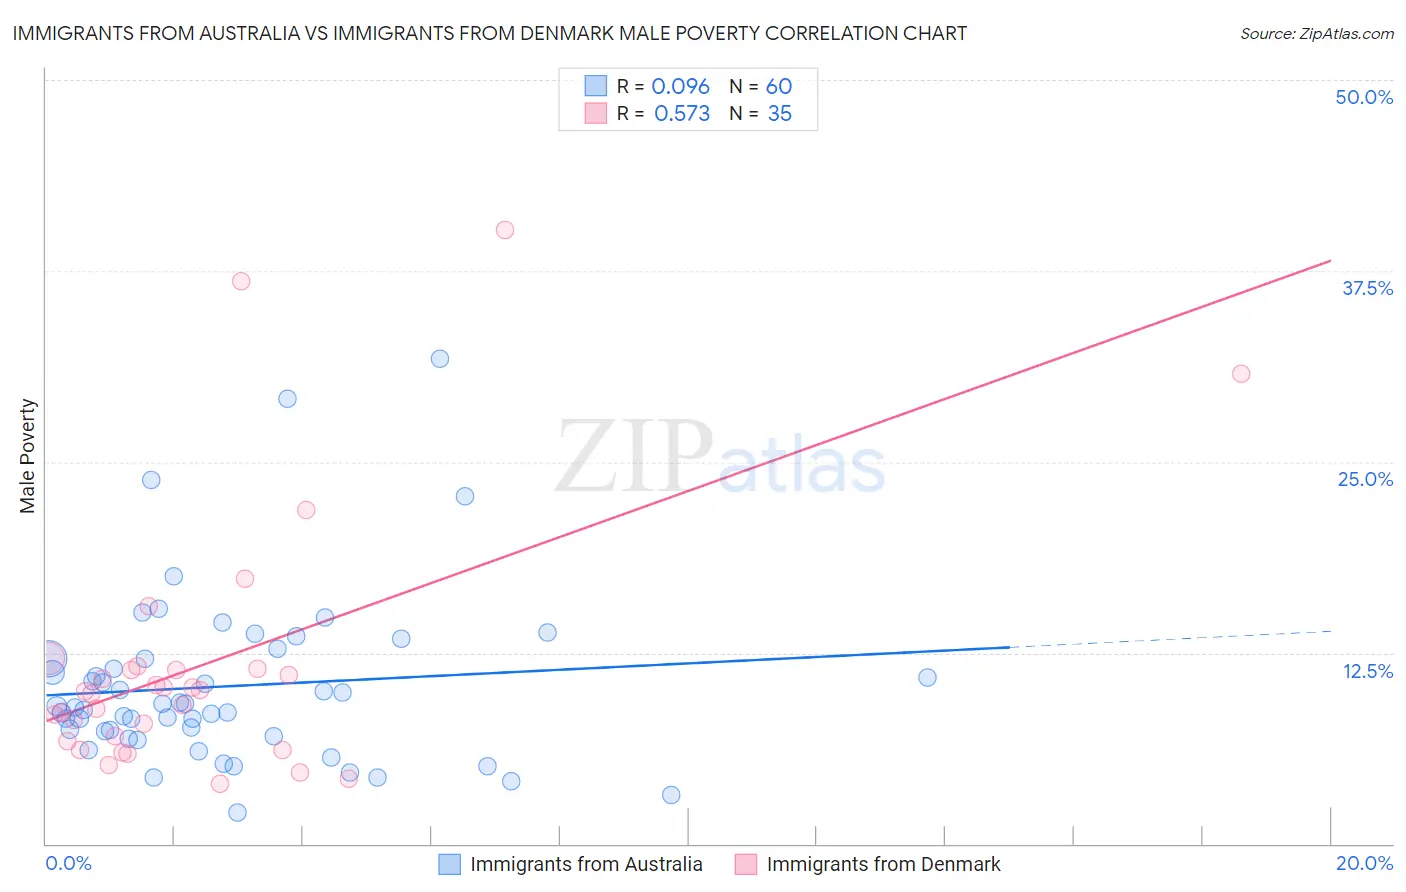
Immigrants from Australia vs Immigrants from Denmark Male Poverty Correlation Chart

The statistical analysis conducted on geographies consisting of 227,114,617 people shows a slight positive correlation between the proportion of Immigrants from Australia and poverty level among males in the United States with a correlation coefficient (R) of 0.096 and weighted average of 10.2%. Similarly, the statistical analysis conducted on geographies consisting of 136,389,161 people shows a substantial positive correlation between the proportion of Immigrants from Denmark and poverty level among males in the United States with a correlation coefficient (R) of 0.573 and weighted average of 10.4%, a difference of 1.5%.
Immigrants from Australia vs Immigrants from Denmark Male Poverty

Male Poverty Correlation Summary

MeasurementImmigrants from AustraliaImmigrants from Denmark
Minimum2.0%4.0%
Maximum31.8%40.2%
Range29.8%36.2%
Mean10.3%11.7%
Median8.9%10.0%
Interquartile 25% (IQ1)7.2%6.7%
Interquartile 75% (IQ3)12.1%11.5%
Interquartile Range (IQR)4.9%4.8%
Standard Deviation (Sample)5.6%8.4%
Standard Deviation (Population)5.6%8.3%

Demographics Similar to Immigrants from Australia and Immigrants from Denmark by Male Poverty

In terms of male poverty, the demographic groups most similar to Immigrants from Australia are Paraguayan (10.2%, a difference of 0.020%), European (10.2%, a difference of 0.040%), Immigrants from Canada (10.2%, a difference of 0.050%), Immigrants from Asia (10.2%, a difference of 0.13%), and Immigrants from Eastern Europe (10.2%, a difference of 0.21%). Similarly, the demographic groups most similar to Immigrants from Denmark are Cambodian (10.4%, a difference of 0.0%), Northern European (10.4%, a difference of 0.14%), Immigrants from Eastern Asia (10.4%, a difference of 0.18%), Immigrants from England (10.4%, a difference of 0.31%), and Czechoslovakian (10.3%, a difference of 0.36%).
DemographicsRating | RankMale Poverty
Immigrants | Australia
97.1
/100
|
#69
Exceptional
10.2%
Paraguayans
97.1
/100
|
#70
Exceptional
10.2%
Europeans
97.1
/100
|
#71
Exceptional
10.2%
Immigrants | Canada
97.1
/100
|
#72
Exceptional
10.2%
Immigrants | Asia
97.0
/100
|
#73
Exceptional
10.2%
Immigrants | Eastern Europe
96.9
/100
|
#74
Exceptional
10.2%
Carpatho Rusyns
96.9
/100
|
#75
Exceptional
10.2%
Dutch
96.9
/100
|
#76
Exceptional
10.2%
Immigrants | Belgium
96.8
/100
|
#77
Exceptional
10.3%
Irish
96.8
/100
|
#78
Exceptional
10.3%
Immigrants | North America
96.5
/100
|
#79
Exceptional
10.3%
English
96.4
/100
|
#80
Exceptional
10.3%
Belgians
95.9
/100
|
#81
Exceptional
10.3%
Egyptians
95.9
/100
|
#82
Exceptional
10.3%
Immigrants | Sweden
95.7
/100
|
#83
Exceptional
10.3%
Czechoslovakians
95.6
/100
|
#84
Exceptional
10.3%
Immigrants | England
95.5
/100
|
#85
Exceptional
10.4%
Immigrants | Eastern Asia
95.3
/100
|
#86
Exceptional
10.4%
Northern Europeans
95.2
/100
|
#87
Exceptional
10.4%
Cambodians
95.0
/100
|
#88
Exceptional
10.4%
Immigrants | Denmark
95.0
/100
|
#89
Exceptional
10.4%