Ecuadorian vs Immigrants from Grenada Male Poverty
COMPARE
Ecuadorian
Immigrants from Grenada
Male Poverty
Male Poverty Comparison
Ecuadorians
Immigrants from Grenada
12.7%
MALE POVERTY
0.4/ 100
METRIC RATING
238th/ 347
METRIC RANK
14.7%
MALE POVERTY
0.0/ 100
METRIC RATING
318th/ 347
METRIC RANK
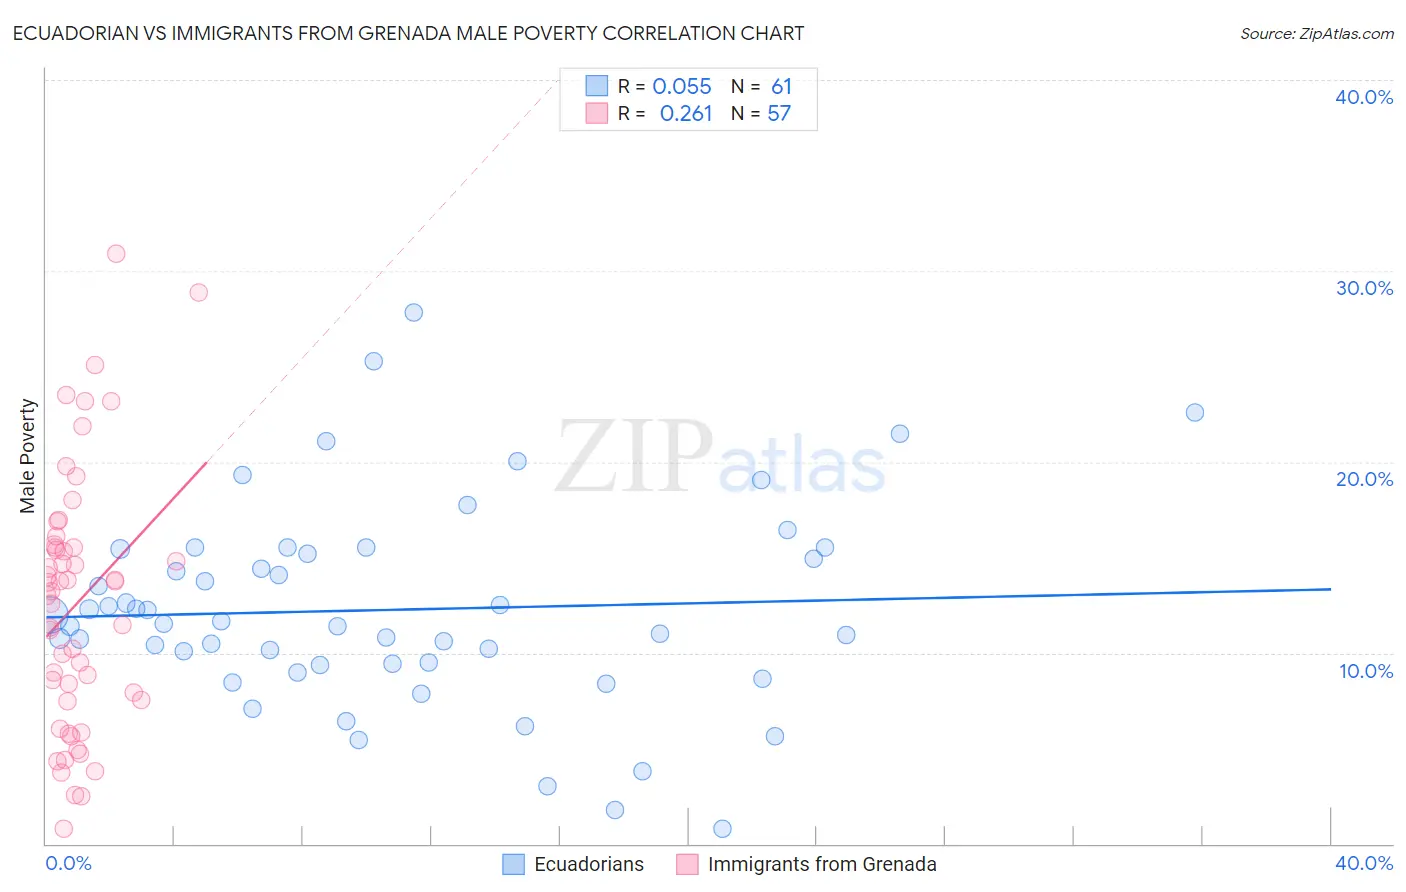
Ecuadorian vs Immigrants from Grenada Male Poverty Correlation Chart
The statistical analysis conducted on geographies consisting of 317,549,368 people shows a slight positive correlation between the proportion of Ecuadorians and poverty level among males in the United States with a correlation coefficient (R) of 0.055 and weighted average of 12.7%. Similarly, the statistical analysis conducted on geographies consisting of 67,181,242 people shows a weak positive correlation between the proportion of Immigrants from Grenada and poverty level among males in the United States with a correlation coefficient (R) of 0.261 and weighted average of 14.7%, a difference of 16.0%.
Male Poverty Correlation Summary
| Measurement | Ecuadorian | Immigrants from Grenada |
| Minimum | 0.81% | 0.80% |
| Maximum | 27.8% | 30.9% |
| Range | 27.0% | 30.1% |
| Mean | 12.3% | 12.6% |
| Median | 11.6% | 13.2% |
| Interquartile 25% (IQ1) | 9.4% | 7.5% |
| Interquartile 75% (IQ3) | 15.3% | 15.6% |
| Interquartile Range (IQR) | 6.0% | 8.1% |
| Standard Deviation (Sample) | 5.3% | 6.7% |
| Standard Deviation (Population) | 5.3% | 6.7% |
Similar Demographics by Male Poverty
Demographics Similar to Ecuadorians by Male Poverty
In terms of male poverty, the demographic groups most similar to Ecuadorians are Ghanaian (12.7%, a difference of 0.0%), French American Indian (12.7%, a difference of 0.030%), Immigrants from Saudi Arabia (12.7%, a difference of 0.080%), Immigrants from Middle Africa (12.7%, a difference of 0.28%), and Immigrants from Laos (12.6%, a difference of 0.32%).
| Demographics | Rating | Rank | Male Poverty |
| Salvadorans | 0.6 /100 | #231 | Tragic 12.6% |
| Nicaraguans | 0.6 /100 | #232 | Tragic 12.6% |
| Fijians | 0.6 /100 | #233 | Tragic 12.6% |
| Immigrants | Armenia | 0.6 /100 | #234 | Tragic 12.6% |
| Immigrants | Laos | 0.5 /100 | #235 | Tragic 12.6% |
| Immigrants | Saudi Arabia | 0.4 /100 | #236 | Tragic 12.7% |
| French American Indians | 0.4 /100 | #237 | Tragic 12.7% |
| Ecuadorians | 0.4 /100 | #238 | Tragic 12.7% |
| Ghanaians | 0.4 /100 | #239 | Tragic 12.7% |
| Immigrants | Middle Africa | 0.4 /100 | #240 | Tragic 12.7% |
| Sudanese | 0.3 /100 | #241 | Tragic 12.8% |
| Nepalese | 0.3 /100 | #242 | Tragic 12.8% |
| Alaskan Athabascans | 0.3 /100 | #243 | Tragic 12.8% |
| Tsimshian | 0.3 /100 | #244 | Tragic 12.8% |
| Liberians | 0.3 /100 | #245 | Tragic 12.8% |
Demographics Similar to Immigrants from Grenada by Male Poverty
In terms of male poverty, the demographic groups most similar to Immigrants from Grenada are U.S. Virgin Islander (14.7%, a difference of 0.030%), Immigrants from Dominica (14.7%, a difference of 0.060%), Immigrants from Congo (14.7%, a difference of 0.12%), British West Indian (14.6%, a difference of 0.74%), and Chippewa (14.6%, a difference of 0.76%).
| Demographics | Rating | Rank | Male Poverty |
| Hondurans | 0.0 /100 | #311 | Tragic 14.3% |
| Choctaw | 0.0 /100 | #312 | Tragic 14.4% |
| Immigrants | Somalia | 0.0 /100 | #313 | Tragic 14.6% |
| Immigrants | Honduras | 0.0 /100 | #314 | Tragic 14.6% |
| Chippewa | 0.0 /100 | #315 | Tragic 14.6% |
| British West Indians | 0.0 /100 | #316 | Tragic 14.6% |
| Immigrants | Dominica | 0.0 /100 | #317 | Tragic 14.7% |
| Immigrants | Grenada | 0.0 /100 | #318 | Tragic 14.7% |
| U.S. Virgin Islanders | 0.0 /100 | #319 | Tragic 14.7% |
| Immigrants | Congo | 0.0 /100 | #320 | Tragic 14.7% |
| Arapaho | 0.0 /100 | #321 | Tragic 15.1% |
| Kiowa | 0.0 /100 | #322 | Tragic 15.2% |
| Colville | 0.0 /100 | #323 | Tragic 15.2% |
| Menominee | 0.0 /100 | #324 | Tragic 15.3% |
| Yakama | 0.0 /100 | #325 | Tragic 15.3% |