Immigrants from Chile vs Immigrants from Denmark Male Poverty
COMPARE
Immigrants from Chile
Immigrants from Denmark
Male Poverty
Male Poverty Comparison
Immigrants from Chile
Immigrants from Denmark
11.1%
MALE POVERTY
57.4/ 100
METRIC RATING
162nd/ 347
METRIC RANK
10.4%
MALE POVERTY
95.0/ 100
METRIC RATING
89th/ 347
METRIC RANK
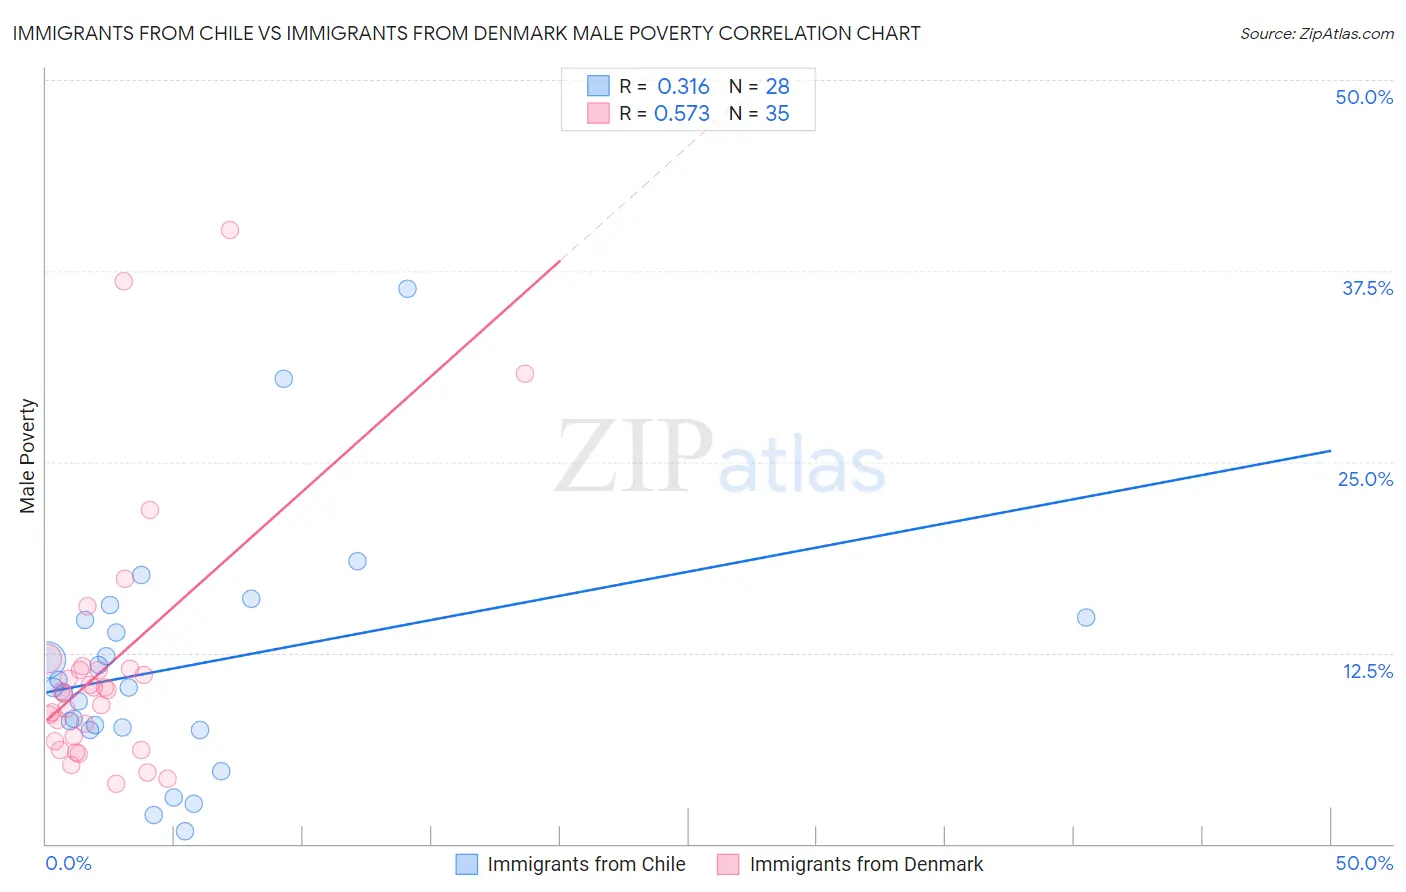
Immigrants from Chile vs Immigrants from Denmark Male Poverty Correlation Chart
The statistical analysis conducted on geographies consisting of 218,566,097 people shows a mild positive correlation between the proportion of Immigrants from Chile and poverty level among males in the United States with a correlation coefficient (R) of 0.316 and weighted average of 11.1%. Similarly, the statistical analysis conducted on geographies consisting of 136,389,161 people shows a substantial positive correlation between the proportion of Immigrants from Denmark and poverty level among males in the United States with a correlation coefficient (R) of 0.573 and weighted average of 10.4%, a difference of 7.0%.
Male Poverty Correlation Summary
| Measurement | Immigrants from Chile | Immigrants from Denmark |
| Minimum | 0.80% | 4.0% |
| Maximum | 36.4% | 40.2% |
| Range | 35.6% | 36.2% |
| Mean | 11.6% | 11.7% |
| Median | 10.2% | 10.0% |
| Interquartile 25% (IQ1) | 7.5% | 6.7% |
| Interquartile 75% (IQ3) | 14.8% | 11.5% |
| Interquartile Range (IQR) | 7.2% | 4.8% |
| Standard Deviation (Sample) | 7.8% | 8.4% |
| Standard Deviation (Population) | 7.6% | 8.3% |
Similar Demographics by Male Poverty
Demographics Similar to Immigrants from Chile by Male Poverty
In terms of male poverty, the demographic groups most similar to Immigrants from Chile are White/Caucasian (11.1%, a difference of 0.060%), Ethiopian (11.1%, a difference of 0.070%), Immigrants from Spain (11.1%, a difference of 0.19%), Immigrants from Albania (11.1%, a difference of 0.21%), and Hungarian (11.1%, a difference of 0.22%).
| Demographics | Rating | Rank | Male Poverty |
| Immigrants | Malaysia | 64.7 /100 | #155 | Good 11.0% |
| Costa Ricans | 63.9 /100 | #156 | Good 11.0% |
| Scotch-Irish | 63.7 /100 | #157 | Good 11.0% |
| Colombians | 63.0 /100 | #158 | Good 11.0% |
| Taiwanese | 62.7 /100 | #159 | Good 11.0% |
| Soviet Union | 60.3 /100 | #160 | Good 11.1% |
| Immigrants | Northern Africa | 59.7 /100 | #161 | Average 11.1% |
| Immigrants | Chile | 57.4 /100 | #162 | Average 11.1% |
| Whites/Caucasians | 56.7 /100 | #163 | Average 11.1% |
| Ethiopians | 56.7 /100 | #164 | Average 11.1% |
| Immigrants | Spain | 55.5 /100 | #165 | Average 11.1% |
| Immigrants | Albania | 55.3 /100 | #166 | Average 11.1% |
| Hungarians | 55.1 /100 | #167 | Average 11.1% |
| Immigrants | Portugal | 54.9 /100 | #168 | Average 11.1% |
| Immigrants | Colombia | 54.2 /100 | #169 | Average 11.1% |
Demographics Similar to Immigrants from Denmark by Male Poverty
In terms of male poverty, the demographic groups most similar to Immigrants from Denmark are Cambodian (10.4%, a difference of 0.0%), Indian (Asian) (10.4%, a difference of 0.020%), British (10.4%, a difference of 0.090%), Northern European (10.4%, a difference of 0.14%), and Immigrants from Eastern Asia (10.4%, a difference of 0.18%).
| Demographics | Rating | Rank | Male Poverty |
| Egyptians | 95.9 /100 | #82 | Exceptional 10.3% |
| Immigrants | Sweden | 95.7 /100 | #83 | Exceptional 10.3% |
| Czechoslovakians | 95.6 /100 | #84 | Exceptional 10.3% |
| Immigrants | England | 95.5 /100 | #85 | Exceptional 10.4% |
| Immigrants | Eastern Asia | 95.3 /100 | #86 | Exceptional 10.4% |
| Northern Europeans | 95.2 /100 | #87 | Exceptional 10.4% |
| Cambodians | 95.0 /100 | #88 | Exceptional 10.4% |
| Immigrants | Denmark | 95.0 /100 | #89 | Exceptional 10.4% |
| Indians (Asian) | 94.9 /100 | #90 | Exceptional 10.4% |
| British | 94.8 /100 | #91 | Exceptional 10.4% |
| Jordanians | 94.4 /100 | #92 | Exceptional 10.4% |
| Australians | 94.4 /100 | #93 | Exceptional 10.4% |
| Immigrants | South Africa | 94.1 /100 | #94 | Exceptional 10.4% |
| Scottish | 94.0 /100 | #95 | Exceptional 10.4% |
| Immigrants | Egypt | 93.7 /100 | #96 | Exceptional 10.4% |