Crow vs Korean Married-Couple Family Poverty
COMPARE
Crow
Korean
Married-Couple Family Poverty
Married-Couple Family Poverty Comparison
Crow
Koreans
9.6%
MARRIED-COUPLE FAMILY POVERTY
0.0/ 100
METRIC RATING
339th/ 347
METRIC RANK
4.6%
MARRIED-COUPLE FAMILY POVERTY
98.3/ 100
METRIC RATING
93rd/ 347
METRIC RANK
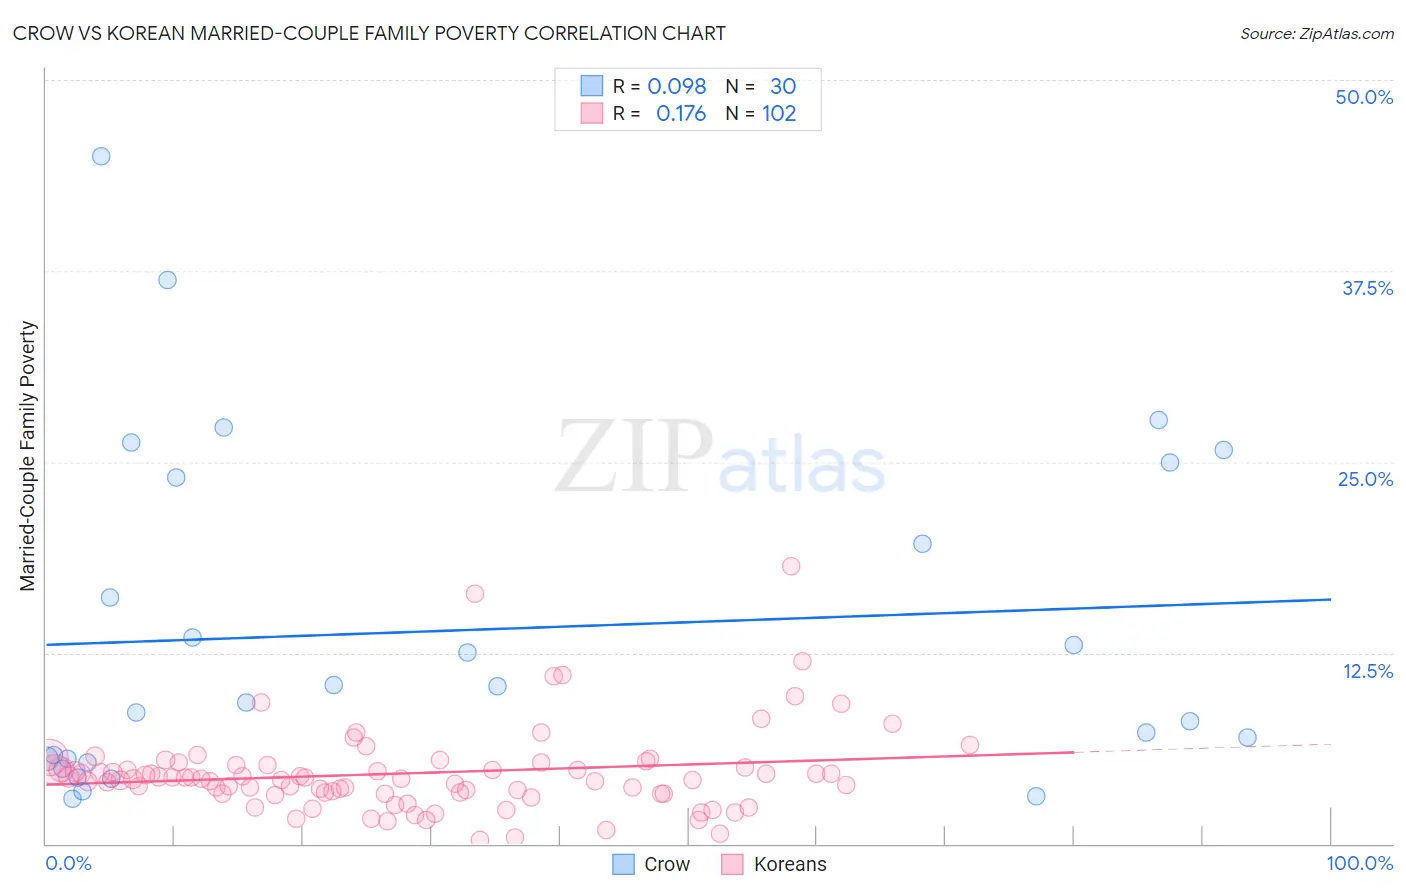
Crow vs Korean Married-Couple Family Poverty Correlation Chart
The statistical analysis conducted on geographies consisting of 59,050,450 people shows a slight positive correlation between the proportion of Crow and poverty level among married-couple families in the United States with a correlation coefficient (R) of 0.098 and weighted average of 9.6%. Similarly, the statistical analysis conducted on geographies consisting of 503,402,719 people shows a poor positive correlation between the proportion of Koreans and poverty level among married-couple families in the United States with a correlation coefficient (R) of 0.176 and weighted average of 4.6%, a difference of 107.8%.
Married-Couple Family Poverty Correlation Summary
| Measurement | Crow | Korean |
| Minimum | 2.9% | 0.27% |
| Maximum | 45.0% | 18.2% |
| Range | 42.1% | 17.9% |
| Mean | 14.0% | 4.6% |
| Median | 9.8% | 4.3% |
| Interquartile 25% (IQ1) | 5.6% | 3.3% |
| Interquartile 75% (IQ3) | 24.0% | 5.1% |
| Interquartile Range (IQR) | 18.4% | 1.8% |
| Standard Deviation (Sample) | 11.0% | 2.8% |
| Standard Deviation (Population) | 10.8% | 2.8% |
Similar Demographics by Married-Couple Family Poverty
Demographics Similar to Crow by Married-Couple Family Poverty
In terms of married-couple family poverty, the demographic groups most similar to Crow are Cheyenne (9.4%, a difference of 1.3%), Yuman (9.7%, a difference of 1.8%), Yakama (9.0%, a difference of 6.7%), Apache (9.0%, a difference of 6.8%), and Sioux (8.7%, a difference of 9.9%).
| Demographics | Rating | Rank | Married-Couple Family Poverty |
| Dominicans | 0.0 /100 | #332 | Tragic 8.3% |
| Lumbee | 0.0 /100 | #333 | Tragic 8.3% |
| Immigrants | Dominican Republic | 0.0 /100 | #334 | Tragic 8.4% |
| Sioux | 0.0 /100 | #335 | Tragic 8.7% |
| Apache | 0.0 /100 | #336 | Tragic 9.0% |
| Yakama | 0.0 /100 | #337 | Tragic 9.0% |
| Cheyenne | 0.0 /100 | #338 | Tragic 9.4% |
| Crow | 0.0 /100 | #339 | Tragic 9.6% |
| Yuman | 0.0 /100 | #340 | Tragic 9.7% |
| Pueblo | 0.0 /100 | #341 | Tragic 11.1% |
| Tohono O'odham | 0.0 /100 | #342 | Tragic 11.2% |
| Pima | 0.0 /100 | #343 | Tragic 11.4% |
| Navajo | 0.0 /100 | #344 | Tragic 11.9% |
| Puerto Ricans | 0.0 /100 | #345 | Tragic 12.6% |
| Immigrants | Yemen | 0.0 /100 | #346 | Tragic 12.8% |
Demographics Similar to Koreans by Married-Couple Family Poverty
In terms of married-couple family poverty, the demographic groups most similar to Koreans are Immigrants from Italy (4.6%, a difference of 0.050%), Portuguese (4.6%, a difference of 0.090%), Immigrants from Poland (4.6%, a difference of 0.17%), Immigrants from Norway (4.6%, a difference of 0.18%), and Immigrants from Belgium (4.6%, a difference of 0.22%).
| Demographics | Rating | Rank | Married-Couple Family Poverty |
| Immigrants | Turkey | 98.6 /100 | #86 | Exceptional 4.6% |
| Immigrants | North Macedonia | 98.6 /100 | #87 | Exceptional 4.6% |
| Bolivians | 98.6 /100 | #88 | Exceptional 4.6% |
| Immigrants | Czechoslovakia | 98.5 /100 | #89 | Exceptional 4.6% |
| Immigrants | Switzerland | 98.5 /100 | #90 | Exceptional 4.6% |
| Basques | 98.5 /100 | #91 | Exceptional 4.6% |
| Immigrants | Norway | 98.4 /100 | #92 | Exceptional 4.6% |
| Koreans | 98.3 /100 | #93 | Exceptional 4.6% |
| Immigrants | Italy | 98.3 /100 | #94 | Exceptional 4.6% |
| Portuguese | 98.3 /100 | #95 | Exceptional 4.6% |
| Immigrants | Poland | 98.3 /100 | #96 | Exceptional 4.6% |
| Immigrants | Belgium | 98.2 /100 | #97 | Exceptional 4.6% |
| Native Hawaiians | 98.0 /100 | #98 | Exceptional 4.6% |
| Immigrants | Europe | 97.9 /100 | #99 | Exceptional 4.6% |
| Immigrants | Western Europe | 97.9 /100 | #100 | Exceptional 4.6% |