Comanche vs Immigrants from Portugal Receiving Food Stamps
COMPARE
Comanche
Immigrants from Portugal
Receiving Food Stamps
Receiving Food Stamps Comparison
Comanche
Immigrants from Portugal
13.3%
RECEIVING FOOD STAMPS
2.4/ 100
METRIC RATING
234th/ 347
METRIC RANK
14.3%
RECEIVING FOOD STAMPS
0.2/ 100
METRIC RATING
263rd/ 347
METRIC RANK
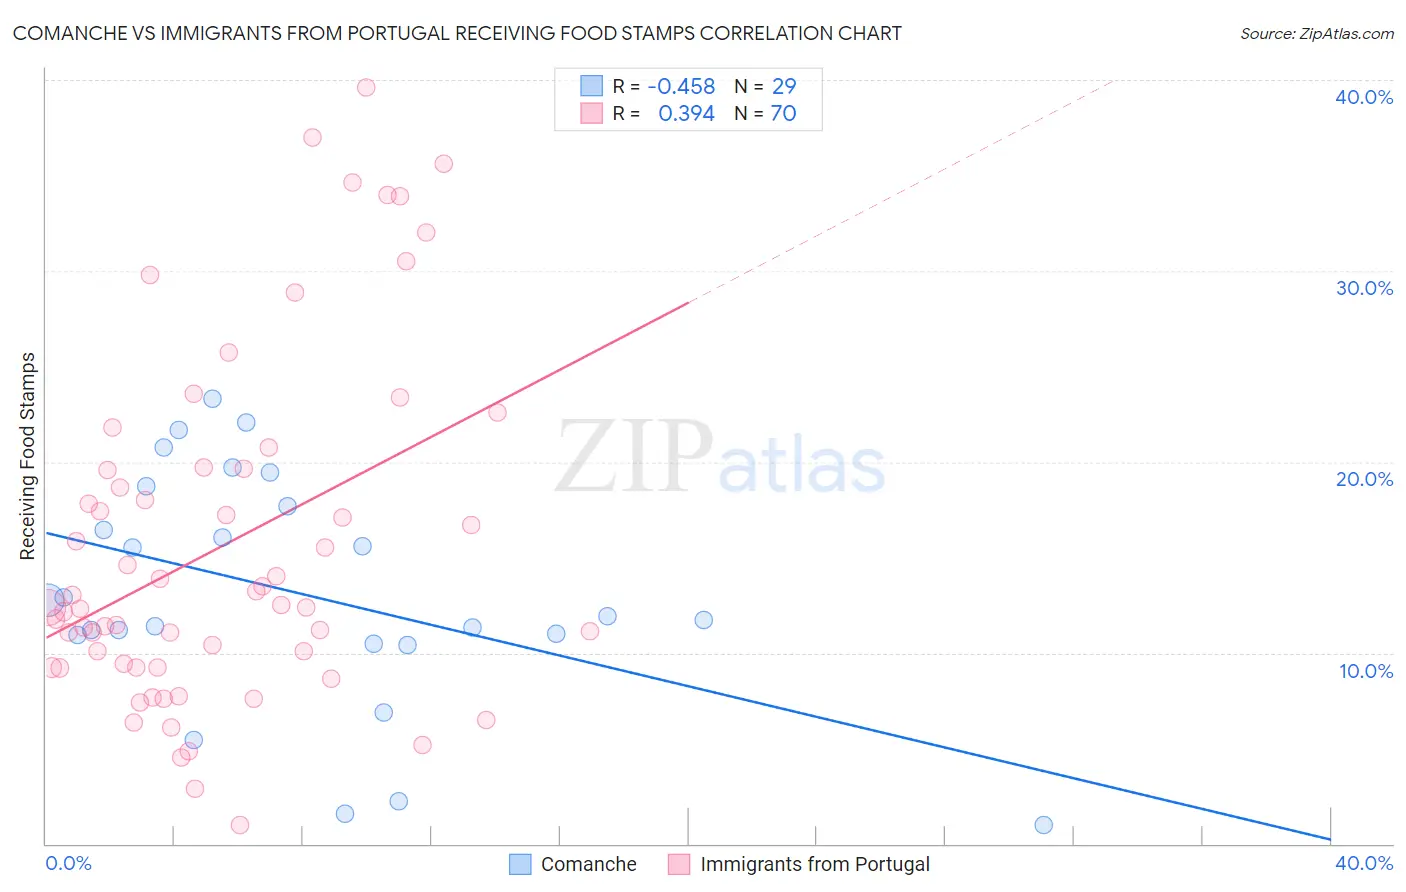
Comanche vs Immigrants from Portugal Receiving Food Stamps Correlation Chart
The statistical analysis conducted on geographies consisting of 109,741,835 people shows a moderate negative correlation between the proportion of Comanche and percentage of population receiving government assistance and/or food stamps in the United States with a correlation coefficient (R) of -0.458 and weighted average of 13.3%. Similarly, the statistical analysis conducted on geographies consisting of 174,504,532 people shows a mild positive correlation between the proportion of Immigrants from Portugal and percentage of population receiving government assistance and/or food stamps in the United States with a correlation coefficient (R) of 0.394 and weighted average of 14.3%, a difference of 7.5%.
Receiving Food Stamps Correlation Summary
| Measurement | Comanche | Immigrants from Portugal |
| Minimum | 1.0% | 1.0% |
| Maximum | 23.3% | 39.6% |
| Range | 22.3% | 38.6% |
| Mean | 13.1% | 15.6% |
| Median | 11.9% | 12.4% |
| Interquartile 25% (IQ1) | 10.7% | 9.2% |
| Interquartile 75% (IQ3) | 18.2% | 19.6% |
| Interquartile Range (IQR) | 7.5% | 10.4% |
| Standard Deviation (Sample) | 6.0% | 9.0% |
| Standard Deviation (Population) | 5.9% | 9.0% |
Similar Demographics by Receiving Food Stamps
Demographics Similar to Comanche by Receiving Food Stamps
In terms of receiving food stamps, the demographic groups most similar to Comanche are Cherokee (13.2%, a difference of 0.13%), Salvadoran (13.2%, a difference of 0.38%), Immigrants from Zaire (13.4%, a difference of 0.77%), Immigrants from Nigeria (13.1%, a difference of 1.1%), and Puget Sound Salish (13.1%, a difference of 1.1%).
| Demographics | Rating | Rank | Receiving Food Stamps |
| Nigerians | 3.5 /100 | #227 | Tragic 13.1% |
| Panamanians | 3.5 /100 | #228 | Tragic 13.1% |
| Ottawa | 3.5 /100 | #229 | Tragic 13.1% |
| Puget Sound Salish | 3.4 /100 | #230 | Tragic 13.1% |
| Immigrants | Nigeria | 3.4 /100 | #231 | Tragic 13.1% |
| Salvadorans | 2.7 /100 | #232 | Tragic 13.2% |
| Cherokee | 2.5 /100 | #233 | Tragic 13.2% |
| Comanche | 2.4 /100 | #234 | Tragic 13.3% |
| Immigrants | Zaire | 1.9 /100 | #235 | Tragic 13.4% |
| Crow | 1.6 /100 | #236 | Tragic 13.4% |
| Immigrants | El Salvador | 1.5 /100 | #237 | Tragic 13.5% |
| French American Indians | 1.4 /100 | #238 | Tragic 13.5% |
| Immigrants | Micronesia | 1.3 /100 | #239 | Tragic 13.5% |
| Iroquois | 1.2 /100 | #240 | Tragic 13.5% |
| Choctaw | 1.0 /100 | #241 | Tragic 13.6% |
Demographics Similar to Immigrants from Portugal by Receiving Food Stamps
In terms of receiving food stamps, the demographic groups most similar to Immigrants from Portugal are Paiute (14.3%, a difference of 0.0%), Immigrants from Uzbekistan (14.3%, a difference of 0.090%), Blackfeet (14.3%, a difference of 0.15%), Cheyenne (14.3%, a difference of 0.23%), and Dutch West Indian (14.3%, a difference of 0.45%).
| Demographics | Rating | Rank | Receiving Food Stamps |
| Japanese | 0.3 /100 | #256 | Tragic 14.1% |
| Arapaho | 0.3 /100 | #257 | Tragic 14.1% |
| Immigrants | Ghana | 0.3 /100 | #258 | Tragic 14.1% |
| Creek | 0.3 /100 | #259 | Tragic 14.1% |
| Central Americans | 0.3 /100 | #260 | Tragic 14.1% |
| Immigrants | Congo | 0.3 /100 | #261 | Tragic 14.1% |
| Paiute | 0.2 /100 | #262 | Tragic 14.3% |
| Immigrants | Portugal | 0.2 /100 | #263 | Tragic 14.3% |
| Immigrants | Uzbekistan | 0.2 /100 | #264 | Tragic 14.3% |
| Blackfeet | 0.2 /100 | #265 | Tragic 14.3% |
| Cheyenne | 0.2 /100 | #266 | Tragic 14.3% |
| Dutch West Indians | 0.2 /100 | #267 | Tragic 14.3% |
| Guatemalans | 0.1 /100 | #268 | Tragic 14.4% |
| Nepalese | 0.1 /100 | #269 | Tragic 14.6% |
| Mexicans | 0.1 /100 | #270 | Tragic 14.6% |