Comanche vs Pima Receiving Food Stamps
COMPARE
Comanche
Pima
Receiving Food Stamps
Receiving Food Stamps Comparison
Comanche
Pima
13.3%
RECEIVING FOOD STAMPS
2.4/ 100
METRIC RATING
234th/ 347
METRIC RANK
19.0%
RECEIVING FOOD STAMPS
0.0/ 100
METRIC RATING
330th/ 347
METRIC RANK
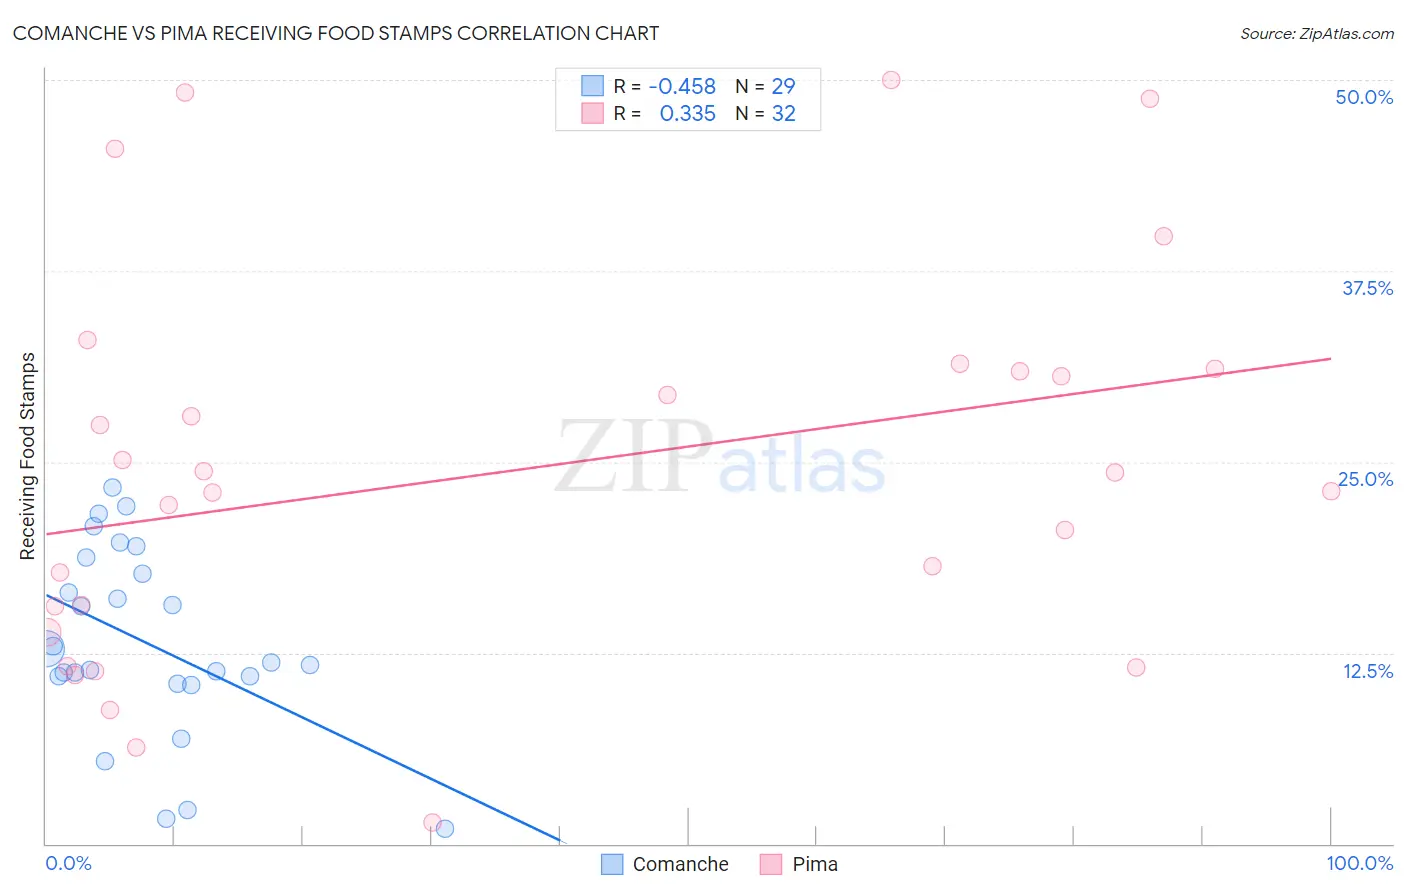
Comanche vs Pima Receiving Food Stamps Correlation Chart
The statistical analysis conducted on geographies consisting of 109,741,835 people shows a moderate negative correlation between the proportion of Comanche and percentage of population receiving government assistance and/or food stamps in the United States with a correlation coefficient (R) of -0.458 and weighted average of 13.3%. Similarly, the statistical analysis conducted on geographies consisting of 61,500,304 people shows a mild positive correlation between the proportion of Pima and percentage of population receiving government assistance and/or food stamps in the United States with a correlation coefficient (R) of 0.335 and weighted average of 19.0%, a difference of 43.0%.
Receiving Food Stamps Correlation Summary
| Measurement | Comanche | Pima |
| Minimum | 1.0% | 1.4% |
| Maximum | 23.3% | 50.0% |
| Range | 22.3% | 48.6% |
| Mean | 13.1% | 24.4% |
| Median | 11.9% | 23.7% |
| Interquartile 25% (IQ1) | 10.7% | 14.7% |
| Interquartile 75% (IQ3) | 18.2% | 31.0% |
| Interquartile Range (IQR) | 7.5% | 16.3% |
| Standard Deviation (Sample) | 6.0% | 12.7% |
| Standard Deviation (Population) | 5.9% | 12.5% |
Similar Demographics by Receiving Food Stamps
Demographics Similar to Comanche by Receiving Food Stamps
In terms of receiving food stamps, the demographic groups most similar to Comanche are Cherokee (13.2%, a difference of 0.13%), Salvadoran (13.2%, a difference of 0.38%), Immigrants from Zaire (13.4%, a difference of 0.77%), Immigrants from Nigeria (13.1%, a difference of 1.1%), and Puget Sound Salish (13.1%, a difference of 1.1%).
| Demographics | Rating | Rank | Receiving Food Stamps |
| Nigerians | 3.5 /100 | #227 | Tragic 13.1% |
| Panamanians | 3.5 /100 | #228 | Tragic 13.1% |
| Ottawa | 3.5 /100 | #229 | Tragic 13.1% |
| Puget Sound Salish | 3.4 /100 | #230 | Tragic 13.1% |
| Immigrants | Nigeria | 3.4 /100 | #231 | Tragic 13.1% |
| Salvadorans | 2.7 /100 | #232 | Tragic 13.2% |
| Cherokee | 2.5 /100 | #233 | Tragic 13.2% |
| Comanche | 2.4 /100 | #234 | Tragic 13.3% |
| Immigrants | Zaire | 1.9 /100 | #235 | Tragic 13.4% |
| Crow | 1.6 /100 | #236 | Tragic 13.4% |
| Immigrants | El Salvador | 1.5 /100 | #237 | Tragic 13.5% |
| French American Indians | 1.4 /100 | #238 | Tragic 13.5% |
| Immigrants | Micronesia | 1.3 /100 | #239 | Tragic 13.5% |
| Iroquois | 1.2 /100 | #240 | Tragic 13.5% |
| Choctaw | 1.0 /100 | #241 | Tragic 13.6% |
Demographics Similar to Pima by Receiving Food Stamps
In terms of receiving food stamps, the demographic groups most similar to Pima are Immigrants from Dominica (18.4%, a difference of 3.0%), Immigrants from Caribbean (19.6%, a difference of 3.4%), Colville (18.3%, a difference of 3.5%), Apache (18.3%, a difference of 3.7%), and Cuban (18.2%, a difference of 4.1%).
| Demographics | Rating | Rank | Receiving Food Stamps |
| Haitians | 0.0 /100 | #323 | Tragic 17.8% |
| British West Indians | 0.0 /100 | #324 | Tragic 17.9% |
| Immigrants | Haiti | 0.0 /100 | #325 | Tragic 18.2% |
| Cubans | 0.0 /100 | #326 | Tragic 18.2% |
| Apache | 0.0 /100 | #327 | Tragic 18.3% |
| Colville | 0.0 /100 | #328 | Tragic 18.3% |
| Immigrants | Dominica | 0.0 /100 | #329 | Tragic 18.4% |
| Pima | 0.0 /100 | #330 | Tragic 19.0% |
| Immigrants | Caribbean | 0.0 /100 | #331 | Tragic 19.6% |
| Pueblo | 0.0 /100 | #332 | Tragic 19.9% |
| Inupiat | 0.0 /100 | #333 | Tragic 20.1% |
| Yuman | 0.0 /100 | #334 | Tragic 20.2% |
| Immigrants | Cuba | 0.0 /100 | #335 | Tragic 20.8% |
| Navajo | 0.0 /100 | #336 | Tragic 21.1% |
| Cape Verdeans | 0.0 /100 | #337 | Tragic 21.1% |