Aleut vs Immigrants from Portugal Receiving Food Stamps
COMPARE
Aleut
Immigrants from Portugal
Receiving Food Stamps
Receiving Food Stamps Comparison
Aleuts
Immigrants from Portugal
12.4%
RECEIVING FOOD STAMPS
17.3/ 100
METRIC RATING
205th/ 347
METRIC RANK
14.3%
RECEIVING FOOD STAMPS
0.2/ 100
METRIC RATING
263rd/ 347
METRIC RANK
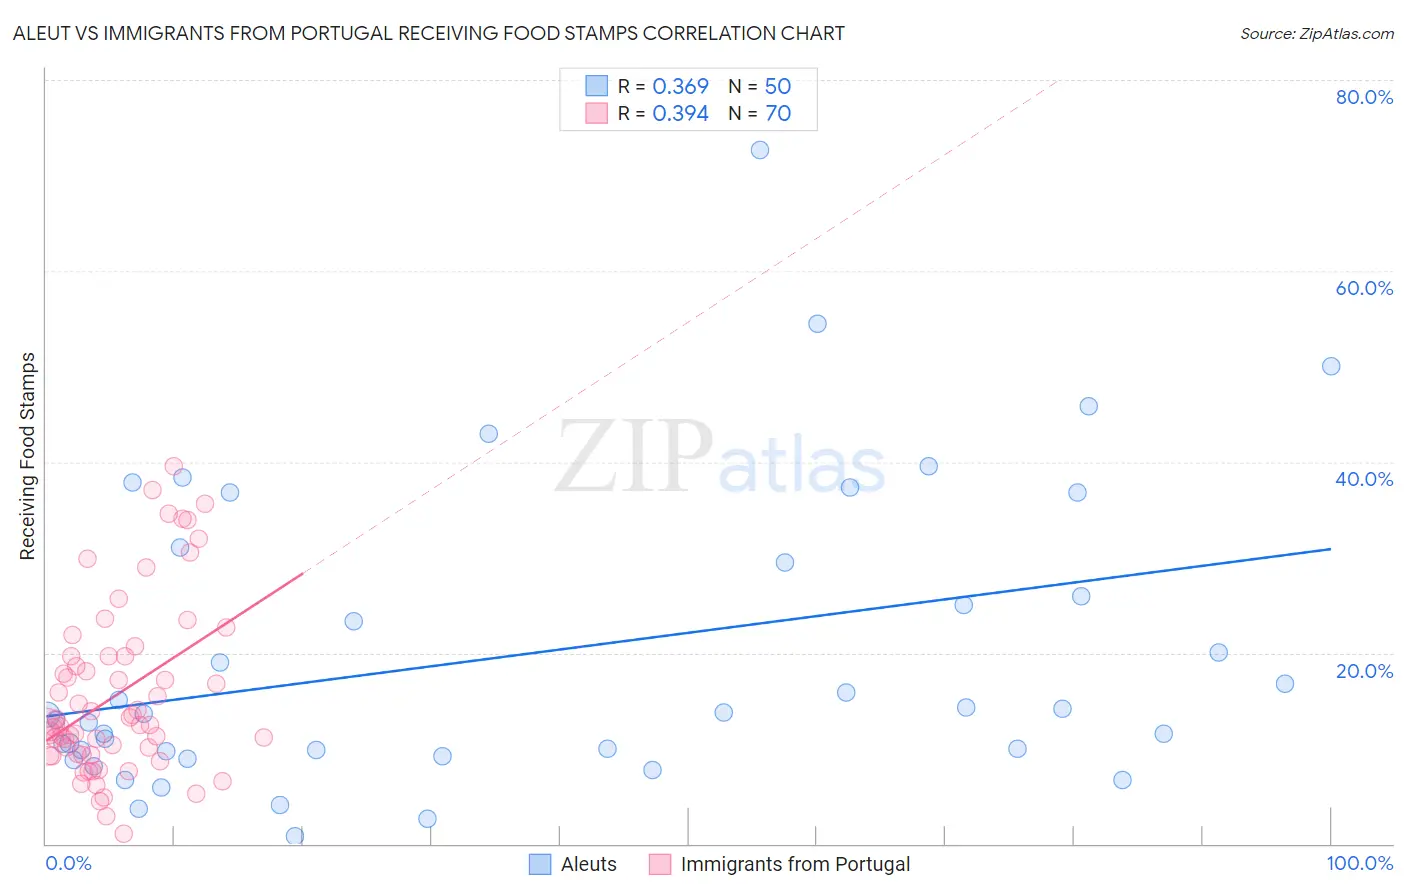
Aleut vs Immigrants from Portugal Receiving Food Stamps Correlation Chart
The statistical analysis conducted on geographies consisting of 61,758,558 people shows a mild positive correlation between the proportion of Aleuts and percentage of population receiving government assistance and/or food stamps in the United States with a correlation coefficient (R) of 0.369 and weighted average of 12.4%. Similarly, the statistical analysis conducted on geographies consisting of 174,504,532 people shows a mild positive correlation between the proportion of Immigrants from Portugal and percentage of population receiving government assistance and/or food stamps in the United States with a correlation coefficient (R) of 0.394 and weighted average of 14.3%, a difference of 15.2%.
Receiving Food Stamps Correlation Summary
| Measurement | Aleut | Immigrants from Portugal |
| Minimum | 0.80% | 1.0% |
| Maximum | 72.7% | 39.6% |
| Range | 71.9% | 38.6% |
| Mean | 19.7% | 15.6% |
| Median | 13.5% | 12.4% |
| Interquartile 25% (IQ1) | 9.7% | 9.2% |
| Interquartile 75% (IQ3) | 29.4% | 19.6% |
| Interquartile Range (IQR) | 19.7% | 10.4% |
| Standard Deviation (Sample) | 15.6% | 9.0% |
| Standard Deviation (Population) | 15.4% | 9.0% |
Similar Demographics by Receiving Food Stamps
Demographics Similar to Aleuts by Receiving Food Stamps
In terms of receiving food stamps, the demographic groups most similar to Aleuts are Immigrants from Thailand (12.4%, a difference of 0.060%), Nonimmigrants (12.4%, a difference of 0.070%), Shoshone (12.4%, a difference of 0.090%), South American (12.4%, a difference of 0.33%), and Immigrants from Venezuela (12.3%, a difference of 0.62%).
| Demographics | Rating | Rank | Receiving Food Stamps |
| Immigrants | Costa Rica | 25.4 /100 | #198 | Fair 12.2% |
| Portuguese | 25.1 /100 | #199 | Fair 12.2% |
| Sierra Leoneans | 23.6 /100 | #200 | Fair 12.2% |
| Ugandans | 22.5 /100 | #201 | Fair 12.2% |
| Immigrants | Venezuela | 20.1 /100 | #202 | Fair 12.3% |
| Shoshone | 17.7 /100 | #203 | Poor 12.4% |
| Immigrants | Nonimmigrants | 17.6 /100 | #204 | Poor 12.4% |
| Aleuts | 17.3 /100 | #205 | Poor 12.4% |
| Immigrants | Thailand | 17.0 /100 | #206 | Poor 12.4% |
| South Americans | 16.0 /100 | #207 | Poor 12.4% |
| Potawatomi | 14.6 /100 | #208 | Poor 12.5% |
| Immigrants | Sierra Leone | 12.9 /100 | #209 | Poor 12.5% |
| Immigrants | Uruguay | 12.8 /100 | #210 | Poor 12.5% |
| Colombians | 10.2 /100 | #211 | Poor 12.6% |
| Malaysians | 8.5 /100 | #212 | Tragic 12.7% |
Demographics Similar to Immigrants from Portugal by Receiving Food Stamps
In terms of receiving food stamps, the demographic groups most similar to Immigrants from Portugal are Paiute (14.3%, a difference of 0.0%), Immigrants from Uzbekistan (14.3%, a difference of 0.090%), Blackfeet (14.3%, a difference of 0.15%), Cheyenne (14.3%, a difference of 0.23%), and Dutch West Indian (14.3%, a difference of 0.45%).
| Demographics | Rating | Rank | Receiving Food Stamps |
| Japanese | 0.3 /100 | #256 | Tragic 14.1% |
| Arapaho | 0.3 /100 | #257 | Tragic 14.1% |
| Immigrants | Ghana | 0.3 /100 | #258 | Tragic 14.1% |
| Creek | 0.3 /100 | #259 | Tragic 14.1% |
| Central Americans | 0.3 /100 | #260 | Tragic 14.1% |
| Immigrants | Congo | 0.3 /100 | #261 | Tragic 14.1% |
| Paiute | 0.2 /100 | #262 | Tragic 14.3% |
| Immigrants | Portugal | 0.2 /100 | #263 | Tragic 14.3% |
| Immigrants | Uzbekistan | 0.2 /100 | #264 | Tragic 14.3% |
| Blackfeet | 0.2 /100 | #265 | Tragic 14.3% |
| Cheyenne | 0.2 /100 | #266 | Tragic 14.3% |
| Dutch West Indians | 0.2 /100 | #267 | Tragic 14.3% |
| Guatemalans | 0.1 /100 | #268 | Tragic 14.4% |
| Nepalese | 0.1 /100 | #269 | Tragic 14.6% |
| Mexicans | 0.1 /100 | #270 | Tragic 14.6% |