Comanche vs Immigrants from Cuba Family Poverty
COMPARE
Comanche
Immigrants from Cuba
Family Poverty
Family Poverty Comparison
Comanche
Immigrants from Cuba
11.0%
FAMILY POVERTY
0.1/ 100
METRIC RATING
267th/ 347
METRIC RANK
11.3%
FAMILY POVERTY
0.0/ 100
METRIC RATING
282nd/ 347
METRIC RANK
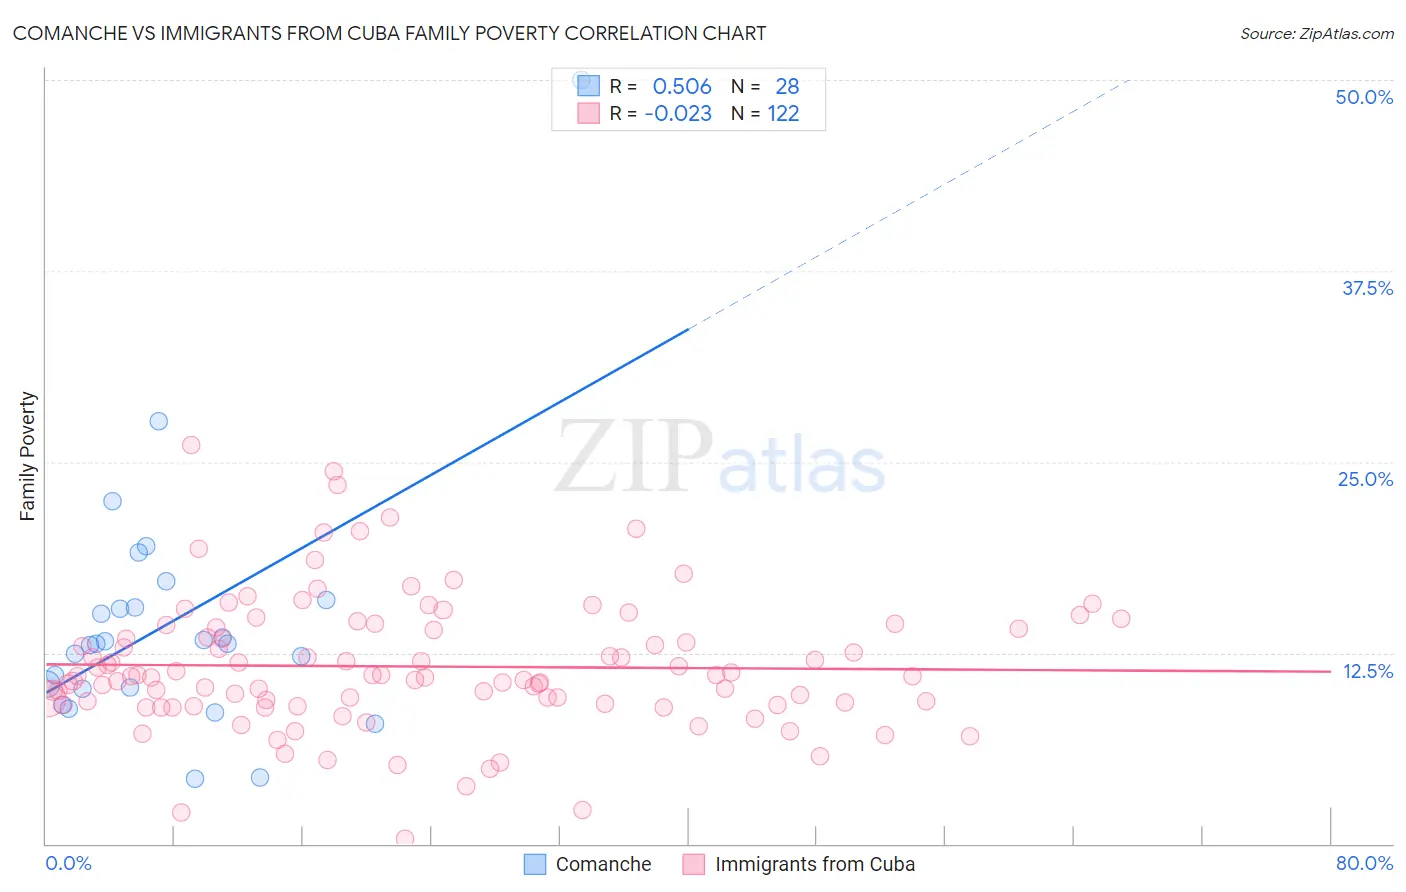
Comanche vs Immigrants from Cuba Family Poverty Correlation Chart
The statistical analysis conducted on geographies consisting of 109,722,823 people shows a substantial positive correlation between the proportion of Comanche and poverty level among families in the United States with a correlation coefficient (R) of 0.506 and weighted average of 11.0%. Similarly, the statistical analysis conducted on geographies consisting of 325,531,975 people shows no correlation between the proportion of Immigrants from Cuba and poverty level among families in the United States with a correlation coefficient (R) of -0.023 and weighted average of 11.3%, a difference of 2.5%.
Family Poverty Correlation Summary
| Measurement | Comanche | Immigrants from Cuba |
| Minimum | 4.3% | 0.31% |
| Maximum | 50.0% | 26.1% |
| Range | 45.7% | 25.8% |
| Mean | 14.5% | 11.6% |
| Median | 13.1% | 11.0% |
| Interquartile 25% (IQ1) | 10.2% | 9.2% |
| Interquartile 75% (IQ3) | 15.7% | 14.1% |
| Interquartile Range (IQR) | 5.5% | 4.9% |
| Standard Deviation (Sample) | 8.6% | 4.3% |
| Standard Deviation (Population) | 8.4% | 4.3% |
Demographics Similar to Comanche and Immigrants from Cuba by Family Poverty
In terms of family poverty, the demographic groups most similar to Comanche are Immigrants from El Salvador (11.0%, a difference of 0.010%), Jamaican (11.1%, a difference of 0.10%), Immigrants from Ecuador (11.1%, a difference of 0.58%), Immigrants from Nicaragua (11.1%, a difference of 0.59%), and Immigrants from Bahamas (11.1%, a difference of 0.84%). Similarly, the demographic groups most similar to Immigrants from Cuba are Indonesian (11.3%, a difference of 0.040%), Yaqui (11.3%, a difference of 0.16%), Immigrants from West Indies (11.3%, a difference of 0.26%), Belizean (11.3%, a difference of 0.53%), and Blackfeet (11.3%, a difference of 0.57%).
| Demographics | Rating | Rank | Family Poverty |
| Trinidadians and Tobagonians | 0.1 /100 | #264 | Tragic 10.9% |
| Immigrants | Trinidad and Tobago | 0.1 /100 | #265 | Tragic 10.9% |
| Immigrants | El Salvador | 0.1 /100 | #266 | Tragic 11.0% |
| Comanche | 0.1 /100 | #267 | Tragic 11.0% |
| Jamaicans | 0.1 /100 | #268 | Tragic 11.1% |
| Immigrants | Ecuador | 0.1 /100 | #269 | Tragic 11.1% |
| Immigrants | Nicaragua | 0.1 /100 | #270 | Tragic 11.1% |
| Immigrants | Bahamas | 0.1 /100 | #271 | Tragic 11.1% |
| Immigrants | Jamaica | 0.1 /100 | #272 | Tragic 11.2% |
| Somalis | 0.1 /100 | #273 | Tragic 11.2% |
| Spanish Americans | 0.1 /100 | #274 | Tragic 11.2% |
| Central Americans | 0.1 /100 | #275 | Tragic 11.2% |
| Immigrants | Guyana | 0.1 /100 | #276 | Tragic 11.2% |
| Chippewa | 0.1 /100 | #277 | Tragic 11.2% |
| Guyanese | 0.1 /100 | #278 | Tragic 11.2% |
| Blackfeet | 0.0 /100 | #279 | Tragic 11.3% |
| Belizeans | 0.0 /100 | #280 | Tragic 11.3% |
| Immigrants | West Indies | 0.0 /100 | #281 | Tragic 11.3% |
| Immigrants | Cuba | 0.0 /100 | #282 | Tragic 11.3% |
| Indonesians | 0.0 /100 | #283 | Tragic 11.3% |
| Yaqui | 0.0 /100 | #284 | Tragic 11.3% |