Armenian vs Immigrants from Cuba Family Poverty
COMPARE
Armenian
Immigrants from Cuba
Family Poverty
Family Poverty Comparison
Armenians
Immigrants from Cuba
8.5%
FAMILY POVERTY
84.6/ 100
METRIC RATING
138th/ 347
METRIC RANK
11.3%
FAMILY POVERTY
0.0/ 100
METRIC RATING
282nd/ 347
METRIC RANK
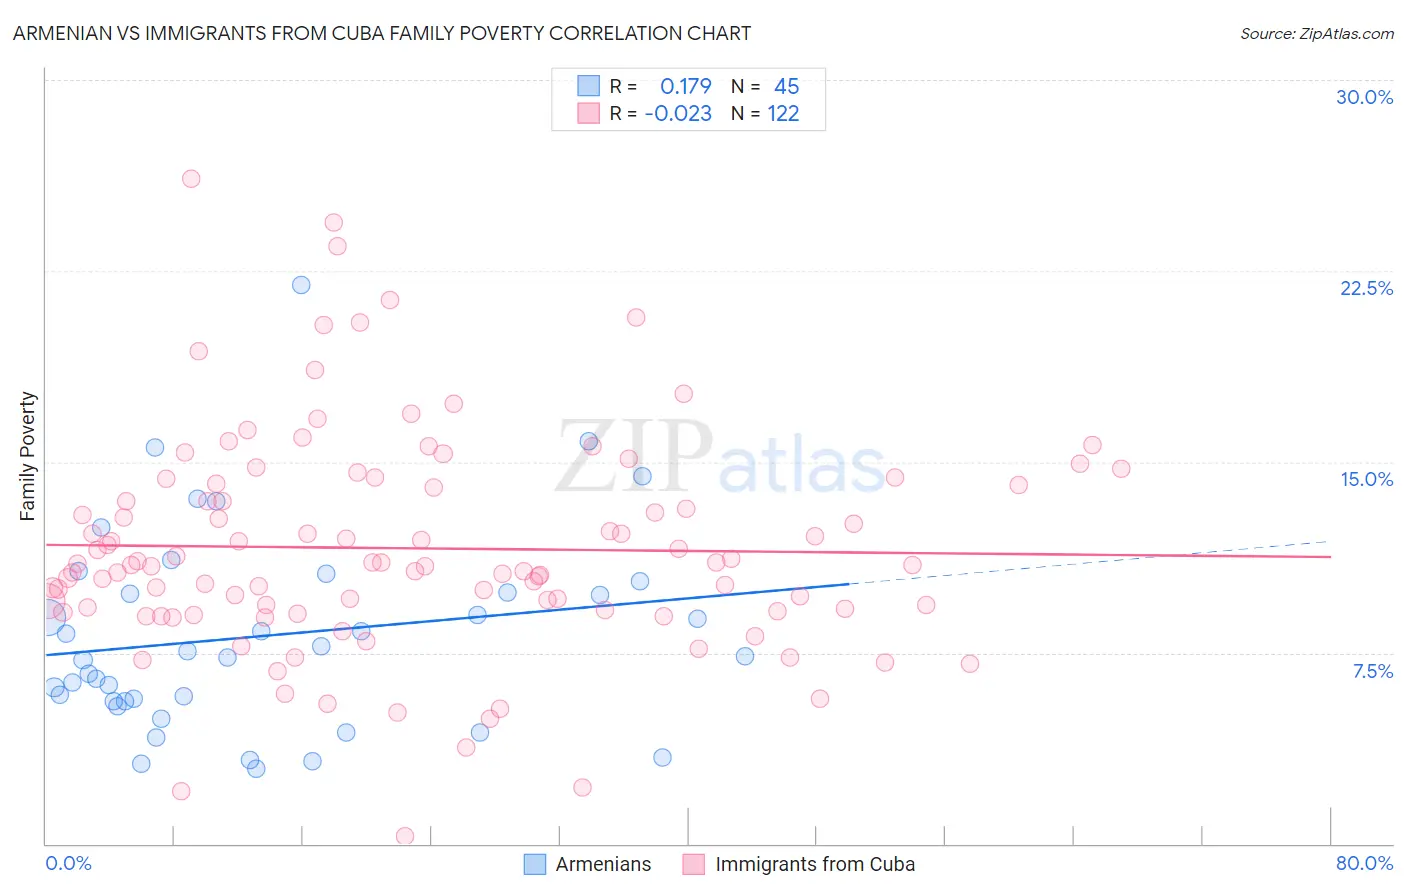
Armenian vs Immigrants from Cuba Family Poverty Correlation Chart
The statistical analysis conducted on geographies consisting of 310,074,733 people shows a poor positive correlation between the proportion of Armenians and poverty level among families in the United States with a correlation coefficient (R) of 0.179 and weighted average of 8.5%. Similarly, the statistical analysis conducted on geographies consisting of 325,531,975 people shows no correlation between the proportion of Immigrants from Cuba and poverty level among families in the United States with a correlation coefficient (R) of -0.023 and weighted average of 11.3%, a difference of 33.1%.
Family Poverty Correlation Summary
| Measurement | Armenian | Immigrants from Cuba |
| Minimum | 3.0% | 0.31% |
| Maximum | 22.0% | 26.1% |
| Range | 19.0% | 25.8% |
| Mean | 8.2% | 11.6% |
| Median | 7.4% | 11.0% |
| Interquartile 25% (IQ1) | 5.6% | 9.2% |
| Interquartile 75% (IQ3) | 10.1% | 14.1% |
| Interquartile Range (IQR) | 4.5% | 4.9% |
| Standard Deviation (Sample) | 4.0% | 4.3% |
| Standard Deviation (Population) | 3.9% | 4.3% |
Similar Demographics by Family Poverty
Demographics Similar to Armenians by Family Poverty
In terms of family poverty, the demographic groups most similar to Armenians are Immigrants from Nepal (8.5%, a difference of 0.12%), Immigrants from Kazakhstan (8.5%, a difference of 0.15%), Immigrants from Ukraine (8.5%, a difference of 0.18%), Yugoslavian (8.5%, a difference of 0.30%), and Immigrants from Germany (8.5%, a difference of 0.33%).
| Demographics | Rating | Rank | Family Poverty |
| Puget Sound Salish | 88.6 /100 | #131 | Excellent 8.4% |
| Immigrants | Argentina | 88.2 /100 | #132 | Excellent 8.4% |
| Sri Lankans | 86.6 /100 | #133 | Excellent 8.5% |
| Chileans | 86.6 /100 | #134 | Excellent 8.5% |
| Immigrants | Malaysia | 86.5 /100 | #135 | Excellent 8.5% |
| Immigrants | Brazil | 86.3 /100 | #136 | Excellent 8.5% |
| Immigrants | Southern Europe | 86.0 /100 | #137 | Excellent 8.5% |
| Armenians | 84.6 /100 | #138 | Excellent 8.5% |
| Immigrants | Nepal | 84.2 /100 | #139 | Excellent 8.5% |
| Immigrants | Kazakhstan | 84.1 /100 | #140 | Excellent 8.5% |
| Immigrants | Ukraine | 83.9 /100 | #141 | Excellent 8.5% |
| Yugoslavians | 83.5 /100 | #142 | Excellent 8.5% |
| Immigrants | Germany | 83.3 /100 | #143 | Excellent 8.5% |
| Albanians | 83.3 /100 | #144 | Excellent 8.5% |
| Immigrants | South Eastern Asia | 83.2 /100 | #145 | Excellent 8.5% |
Demographics Similar to Immigrants from Cuba by Family Poverty
In terms of family poverty, the demographic groups most similar to Immigrants from Cuba are Indonesian (11.3%, a difference of 0.040%), Yaqui (11.3%, a difference of 0.16%), Barbadian (11.3%, a difference of 0.24%), Immigrants from West Indies (11.3%, a difference of 0.26%), and Belizean (11.3%, a difference of 0.53%).
| Demographics | Rating | Rank | Family Poverty |
| Central Americans | 0.1 /100 | #275 | Tragic 11.2% |
| Immigrants | Guyana | 0.1 /100 | #276 | Tragic 11.2% |
| Chippewa | 0.1 /100 | #277 | Tragic 11.2% |
| Guyanese | 0.1 /100 | #278 | Tragic 11.2% |
| Blackfeet | 0.0 /100 | #279 | Tragic 11.3% |
| Belizeans | 0.0 /100 | #280 | Tragic 11.3% |
| Immigrants | West Indies | 0.0 /100 | #281 | Tragic 11.3% |
| Immigrants | Cuba | 0.0 /100 | #282 | Tragic 11.3% |
| Indonesians | 0.0 /100 | #283 | Tragic 11.3% |
| Yaqui | 0.0 /100 | #284 | Tragic 11.3% |
| Barbadians | 0.0 /100 | #285 | Tragic 11.3% |
| Senegalese | 0.0 /100 | #286 | Tragic 11.5% |
| Vietnamese | 0.0 /100 | #287 | Tragic 11.5% |
| Immigrants | Belize | 0.0 /100 | #288 | Tragic 11.5% |
| Immigrants | Barbados | 0.0 /100 | #289 | Tragic 11.5% |