Black/African American vs Immigrants from Cuba Family Poverty
COMPARE
Black/African American
Immigrants from Cuba
Family Poverty
Family Poverty Comparison
Blacks/African Americans
Immigrants from Cuba
13.3%
FAMILY POVERTY
0.0/ 100
METRIC RATING
329th/ 347
METRIC RANK
11.3%
FAMILY POVERTY
0.0/ 100
METRIC RATING
282nd/ 347
METRIC RANK
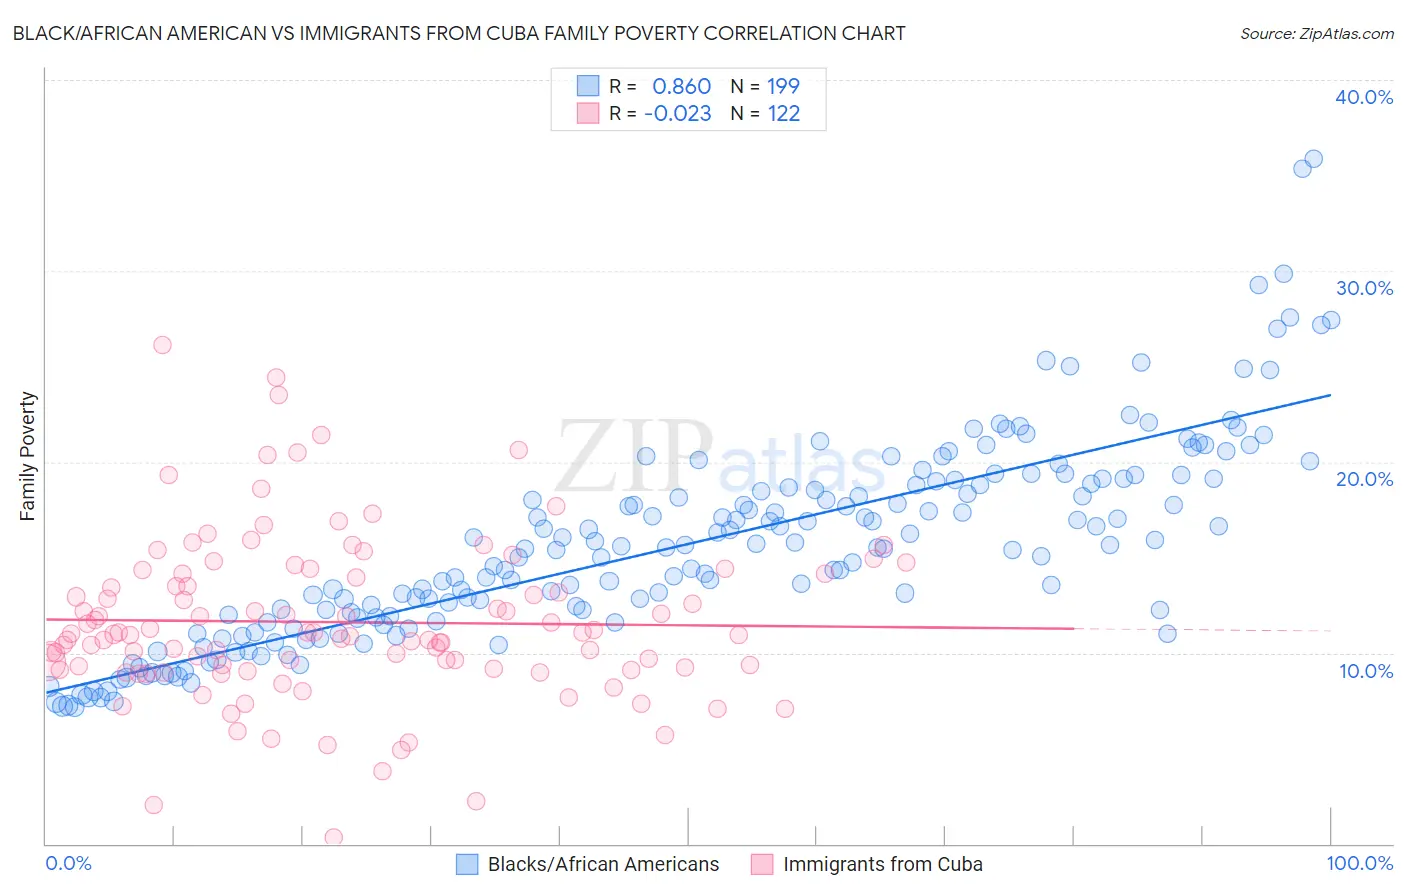
Black/African American vs Immigrants from Cuba Family Poverty Correlation Chart
The statistical analysis conducted on geographies consisting of 562,121,260 people shows a very strong positive correlation between the proportion of Blacks/African Americans and poverty level among families in the United States with a correlation coefficient (R) of 0.860 and weighted average of 13.3%. Similarly, the statistical analysis conducted on geographies consisting of 325,531,975 people shows no correlation between the proportion of Immigrants from Cuba and poverty level among families in the United States with a correlation coefficient (R) of -0.023 and weighted average of 11.3%, a difference of 17.8%.
Family Poverty Correlation Summary
| Measurement | Black/African American | Immigrants from Cuba |
| Minimum | 7.2% | 0.31% |
| Maximum | 35.9% | 26.1% |
| Range | 28.7% | 25.8% |
| Mean | 15.7% | 11.6% |
| Median | 15.5% | 11.0% |
| Interquartile 25% (IQ1) | 11.8% | 9.2% |
| Interquartile 75% (IQ3) | 18.8% | 14.1% |
| Interquartile Range (IQR) | 7.0% | 4.9% |
| Standard Deviation (Sample) | 5.2% | 4.3% |
| Standard Deviation (Population) | 5.2% | 4.3% |
Similar Demographics by Family Poverty
Demographics Similar to Blacks/African Americans by Family Poverty
In terms of family poverty, the demographic groups most similar to Blacks/African Americans are Central American Indian (13.3%, a difference of 0.17%), Yakama (13.1%, a difference of 1.8%), Colville (13.0%, a difference of 2.5%), Paiute (13.0%, a difference of 2.6%), and Immigrants from Dominica (12.7%, a difference of 4.6%).
| Demographics | Rating | Rank | Family Poverty |
| Immigrants | Honduras | 0.0 /100 | #322 | Tragic 12.7% |
| Menominee | 0.0 /100 | #323 | Tragic 12.7% |
| Immigrants | Dominica | 0.0 /100 | #324 | Tragic 12.7% |
| Paiute | 0.0 /100 | #325 | Tragic 13.0% |
| Colville | 0.0 /100 | #326 | Tragic 13.0% |
| Yakama | 0.0 /100 | #327 | Tragic 13.1% |
| Central American Indians | 0.0 /100 | #328 | Tragic 13.3% |
| Blacks/African Americans | 0.0 /100 | #329 | Tragic 13.3% |
| Natives/Alaskans | 0.0 /100 | #330 | Tragic 14.3% |
| Cheyenne | 0.0 /100 | #331 | Tragic 14.3% |
| Dominicans | 0.0 /100 | #332 | Tragic 14.3% |
| Immigrants | Dominican Republic | 0.0 /100 | #333 | Tragic 14.4% |
| Houma | 0.0 /100 | #334 | Tragic 14.6% |
| Apache | 0.0 /100 | #335 | Tragic 14.7% |
| Sioux | 0.0 /100 | #336 | Tragic 15.9% |
Demographics Similar to Immigrants from Cuba by Family Poverty
In terms of family poverty, the demographic groups most similar to Immigrants from Cuba are Indonesian (11.3%, a difference of 0.040%), Yaqui (11.3%, a difference of 0.16%), Barbadian (11.3%, a difference of 0.24%), Immigrants from West Indies (11.3%, a difference of 0.26%), and Belizean (11.3%, a difference of 0.53%).
| Demographics | Rating | Rank | Family Poverty |
| Central Americans | 0.1 /100 | #275 | Tragic 11.2% |
| Immigrants | Guyana | 0.1 /100 | #276 | Tragic 11.2% |
| Chippewa | 0.1 /100 | #277 | Tragic 11.2% |
| Guyanese | 0.1 /100 | #278 | Tragic 11.2% |
| Blackfeet | 0.0 /100 | #279 | Tragic 11.3% |
| Belizeans | 0.0 /100 | #280 | Tragic 11.3% |
| Immigrants | West Indies | 0.0 /100 | #281 | Tragic 11.3% |
| Immigrants | Cuba | 0.0 /100 | #282 | Tragic 11.3% |
| Indonesians | 0.0 /100 | #283 | Tragic 11.3% |
| Yaqui | 0.0 /100 | #284 | Tragic 11.3% |
| Barbadians | 0.0 /100 | #285 | Tragic 11.3% |
| Senegalese | 0.0 /100 | #286 | Tragic 11.5% |
| Vietnamese | 0.0 /100 | #287 | Tragic 11.5% |
| Immigrants | Belize | 0.0 /100 | #288 | Tragic 11.5% |
| Immigrants | Barbados | 0.0 /100 | #289 | Tragic 11.5% |