Comanche vs Immigrants from Scotland Family Poverty
COMPARE
Comanche
Immigrants from Scotland
Family Poverty
Family Poverty Comparison
Comanche
Immigrants from Scotland
11.0%
FAMILY POVERTY
0.1/ 100
METRIC RATING
267th/ 347
METRIC RANK
7.3%
FAMILY POVERTY
99.6/ 100
METRIC RATING
27th/ 347
METRIC RANK
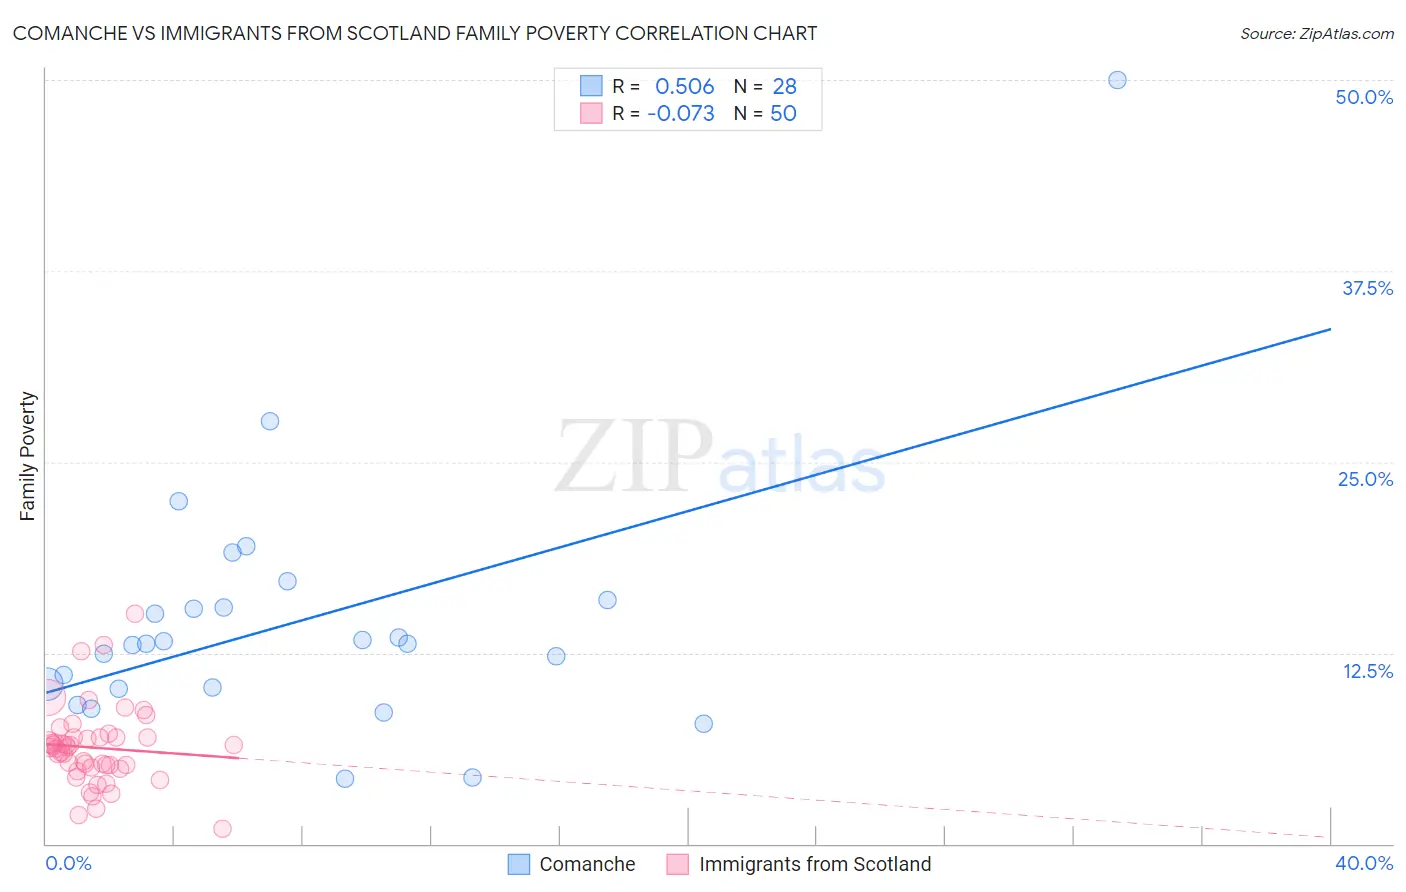
Comanche vs Immigrants from Scotland Family Poverty Correlation Chart
The statistical analysis conducted on geographies consisting of 109,722,823 people shows a substantial positive correlation between the proportion of Comanche and poverty level among families in the United States with a correlation coefficient (R) of 0.506 and weighted average of 11.0%. Similarly, the statistical analysis conducted on geographies consisting of 196,152,148 people shows a slight negative correlation between the proportion of Immigrants from Scotland and poverty level among families in the United States with a correlation coefficient (R) of -0.073 and weighted average of 7.3%, a difference of 50.5%.
Family Poverty Correlation Summary
| Measurement | Comanche | Immigrants from Scotland |
| Minimum | 4.3% | 1.00% |
| Maximum | 50.0% | 15.1% |
| Range | 45.7% | 14.1% |
| Mean | 14.5% | 6.3% |
| Median | 13.1% | 6.3% |
| Interquartile 25% (IQ1) | 10.2% | 5.0% |
| Interquartile 75% (IQ3) | 15.7% | 7.0% |
| Interquartile Range (IQR) | 5.5% | 2.0% |
| Standard Deviation (Sample) | 8.6% | 2.6% |
| Standard Deviation (Population) | 8.4% | 2.6% |
Similar Demographics by Family Poverty
Demographics Similar to Comanche by Family Poverty
In terms of family poverty, the demographic groups most similar to Comanche are Immigrants from El Salvador (11.0%, a difference of 0.010%), Jamaican (11.1%, a difference of 0.10%), Immigrants from Ecuador (11.1%, a difference of 0.58%), Immigrants from Nicaragua (11.1%, a difference of 0.59%), and Immigrants from Bahamas (11.1%, a difference of 0.84%).
| Demographics | Rating | Rank | Family Poverty |
| Bangladeshis | 0.2 /100 | #260 | Tragic 10.9% |
| Shoshone | 0.2 /100 | #261 | Tragic 10.9% |
| Spanish American Indians | 0.2 /100 | #262 | Tragic 10.9% |
| Cape Verdeans | 0.1 /100 | #263 | Tragic 10.9% |
| Trinidadians and Tobagonians | 0.1 /100 | #264 | Tragic 10.9% |
| Immigrants | Trinidad and Tobago | 0.1 /100 | #265 | Tragic 10.9% |
| Immigrants | El Salvador | 0.1 /100 | #266 | Tragic 11.0% |
| Comanche | 0.1 /100 | #267 | Tragic 11.0% |
| Jamaicans | 0.1 /100 | #268 | Tragic 11.1% |
| Immigrants | Ecuador | 0.1 /100 | #269 | Tragic 11.1% |
| Immigrants | Nicaragua | 0.1 /100 | #270 | Tragic 11.1% |
| Immigrants | Bahamas | 0.1 /100 | #271 | Tragic 11.1% |
| Immigrants | Jamaica | 0.1 /100 | #272 | Tragic 11.2% |
| Somalis | 0.1 /100 | #273 | Tragic 11.2% |
| Spanish Americans | 0.1 /100 | #274 | Tragic 11.2% |
Demographics Similar to Immigrants from Scotland by Family Poverty
In terms of family poverty, the demographic groups most similar to Immigrants from Scotland are Cypriot (7.3%, a difference of 0.020%), Croatian (7.3%, a difference of 0.26%), Burmese (7.3%, a difference of 0.26%), Immigrants from Korea (7.4%, a difference of 0.39%), and Immigrants from Northern Europe (7.4%, a difference of 0.55%).
| Demographics | Rating | Rank | Family Poverty |
| Immigrants | Hong Kong | 99.7 /100 | #20 | Exceptional 7.3% |
| Immigrants | Iran | 99.7 /100 | #21 | Exceptional 7.3% |
| Danes | 99.7 /100 | #22 | Exceptional 7.3% |
| Assyrians/Chaldeans/Syriacs | 99.7 /100 | #23 | Exceptional 7.3% |
| Croatians | 99.7 /100 | #24 | Exceptional 7.3% |
| Burmese | 99.7 /100 | #25 | Exceptional 7.3% |
| Cypriots | 99.6 /100 | #26 | Exceptional 7.3% |
| Immigrants | Scotland | 99.6 /100 | #27 | Exceptional 7.3% |
| Immigrants | Korea | 99.6 /100 | #28 | Exceptional 7.4% |
| Immigrants | Northern Europe | 99.6 /100 | #29 | Exceptional 7.4% |
| Italians | 99.6 /100 | #30 | Exceptional 7.4% |
| Czechs | 99.6 /100 | #31 | Exceptional 7.4% |
| Poles | 99.5 /100 | #32 | Exceptional 7.4% |
| Immigrants | Japan | 99.5 /100 | #33 | Exceptional 7.4% |
| Russians | 99.5 /100 | #34 | Exceptional 7.5% |