Comanche vs Immigrants from North America Family Poverty
COMPARE
Comanche
Immigrants from North America
Family Poverty
Family Poverty Comparison
Comanche
Immigrants from North America
11.0%
FAMILY POVERTY
0.1/ 100
METRIC RATING
267th/ 347
METRIC RANK
7.9%
FAMILY POVERTY
97.9/ 100
METRIC RATING
78th/ 347
METRIC RANK
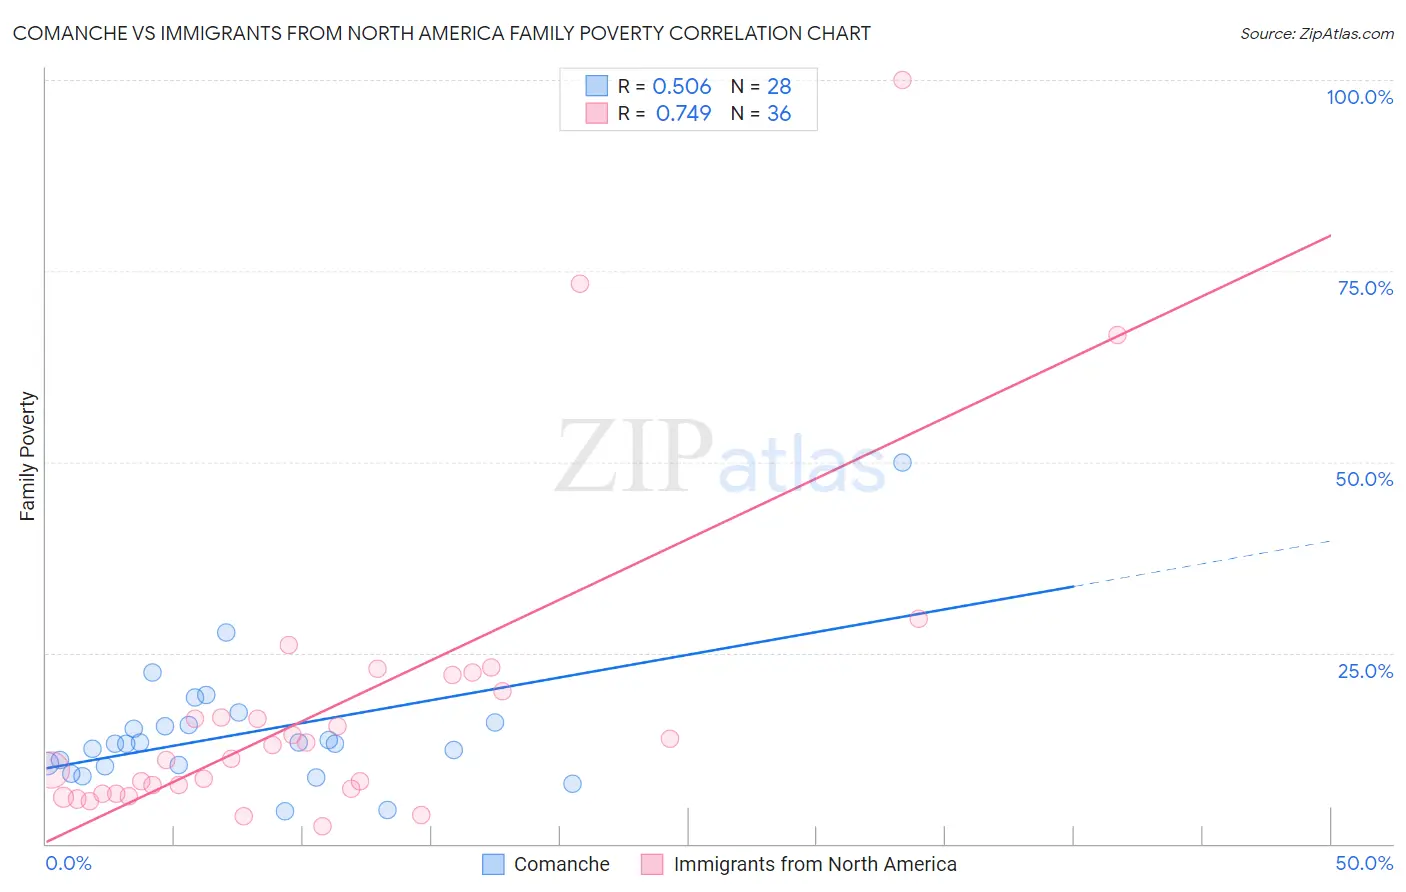
Comanche vs Immigrants from North America Family Poverty Correlation Chart
The statistical analysis conducted on geographies consisting of 109,722,823 people shows a substantial positive correlation between the proportion of Comanche and poverty level among families in the United States with a correlation coefficient (R) of 0.506 and weighted average of 11.0%. Similarly, the statistical analysis conducted on geographies consisting of 460,351,855 people shows a strong positive correlation between the proportion of Immigrants from North America and poverty level among families in the United States with a correlation coefficient (R) of 0.749 and weighted average of 7.9%, a difference of 40.3%.
Family Poverty Correlation Summary
| Measurement | Comanche | Immigrants from North America |
| Minimum | 4.3% | 2.3% |
| Maximum | 50.0% | 100.0% |
| Range | 45.7% | 97.7% |
| Mean | 14.5% | 18.1% |
| Median | 13.1% | 12.1% |
| Interquartile 25% (IQ1) | 10.2% | 6.9% |
| Interquartile 75% (IQ3) | 15.7% | 21.0% |
| Interquartile Range (IQR) | 5.5% | 14.2% |
| Standard Deviation (Sample) | 8.6% | 20.6% |
| Standard Deviation (Population) | 8.4% | 20.3% |
Similar Demographics by Family Poverty
Demographics Similar to Comanche by Family Poverty
In terms of family poverty, the demographic groups most similar to Comanche are Immigrants from El Salvador (11.0%, a difference of 0.010%), Jamaican (11.1%, a difference of 0.10%), Immigrants from Ecuador (11.1%, a difference of 0.58%), Immigrants from Nicaragua (11.1%, a difference of 0.59%), and Immigrants from Bahamas (11.1%, a difference of 0.84%).
| Demographics | Rating | Rank | Family Poverty |
| Bangladeshis | 0.2 /100 | #260 | Tragic 10.9% |
| Shoshone | 0.2 /100 | #261 | Tragic 10.9% |
| Spanish American Indians | 0.2 /100 | #262 | Tragic 10.9% |
| Cape Verdeans | 0.1 /100 | #263 | Tragic 10.9% |
| Trinidadians and Tobagonians | 0.1 /100 | #264 | Tragic 10.9% |
| Immigrants | Trinidad and Tobago | 0.1 /100 | #265 | Tragic 10.9% |
| Immigrants | El Salvador | 0.1 /100 | #266 | Tragic 11.0% |
| Comanche | 0.1 /100 | #267 | Tragic 11.0% |
| Jamaicans | 0.1 /100 | #268 | Tragic 11.1% |
| Immigrants | Ecuador | 0.1 /100 | #269 | Tragic 11.1% |
| Immigrants | Nicaragua | 0.1 /100 | #270 | Tragic 11.1% |
| Immigrants | Bahamas | 0.1 /100 | #271 | Tragic 11.1% |
| Immigrants | Jamaica | 0.1 /100 | #272 | Tragic 11.2% |
| Somalis | 0.1 /100 | #273 | Tragic 11.2% |
| Spanish Americans | 0.1 /100 | #274 | Tragic 11.2% |
Demographics Similar to Immigrants from North America by Family Poverty
In terms of family poverty, the demographic groups most similar to Immigrants from North America are Immigrants from Europe (7.9%, a difference of 0.080%), Immigrants from Latvia (7.9%, a difference of 0.12%), Ukrainian (7.9%, a difference of 0.12%), English (7.9%, a difference of 0.14%), and Irish (7.9%, a difference of 0.15%).
| Demographics | Rating | Rank | Family Poverty |
| Cambodians | 98.2 /100 | #71 | Exceptional 7.8% |
| Immigrants | Romania | 98.2 /100 | #72 | Exceptional 7.8% |
| Austrians | 98.2 /100 | #73 | Exceptional 7.8% |
| Immigrants | China | 98.1 /100 | #74 | Exceptional 7.8% |
| Immigrants | Croatia | 98.1 /100 | #75 | Exceptional 7.8% |
| Immigrants | Latvia | 98.0 /100 | #76 | Exceptional 7.9% |
| Ukrainians | 98.0 /100 | #77 | Exceptional 7.9% |
| Immigrants | North America | 97.9 /100 | #78 | Exceptional 7.9% |
| Immigrants | Europe | 97.8 /100 | #79 | Exceptional 7.9% |
| English | 97.8 /100 | #80 | Exceptional 7.9% |
| Irish | 97.8 /100 | #81 | Exceptional 7.9% |
| Immigrants | Poland | 97.8 /100 | #82 | Exceptional 7.9% |
| Slovaks | 97.7 /100 | #83 | Exceptional 7.9% |
| British | 97.5 /100 | #84 | Exceptional 7.9% |
| Immigrants | Asia | 97.4 /100 | #85 | Exceptional 7.9% |