Cheyenne vs Spanish American Indian Married-Couple Family Poverty
COMPARE
Cheyenne
Spanish American Indian
Married-Couple Family Poverty
Married-Couple Family Poverty Comparison
Cheyenne
Spanish American Indians
9.4%
MARRIED-COUPLE FAMILY POVERTY
0.0/ 100
METRIC RATING
338th/ 347
METRIC RANK
7.1%
MARRIED-COUPLE FAMILY POVERTY
0.0/ 100
METRIC RATING
308th/ 347
METRIC RANK
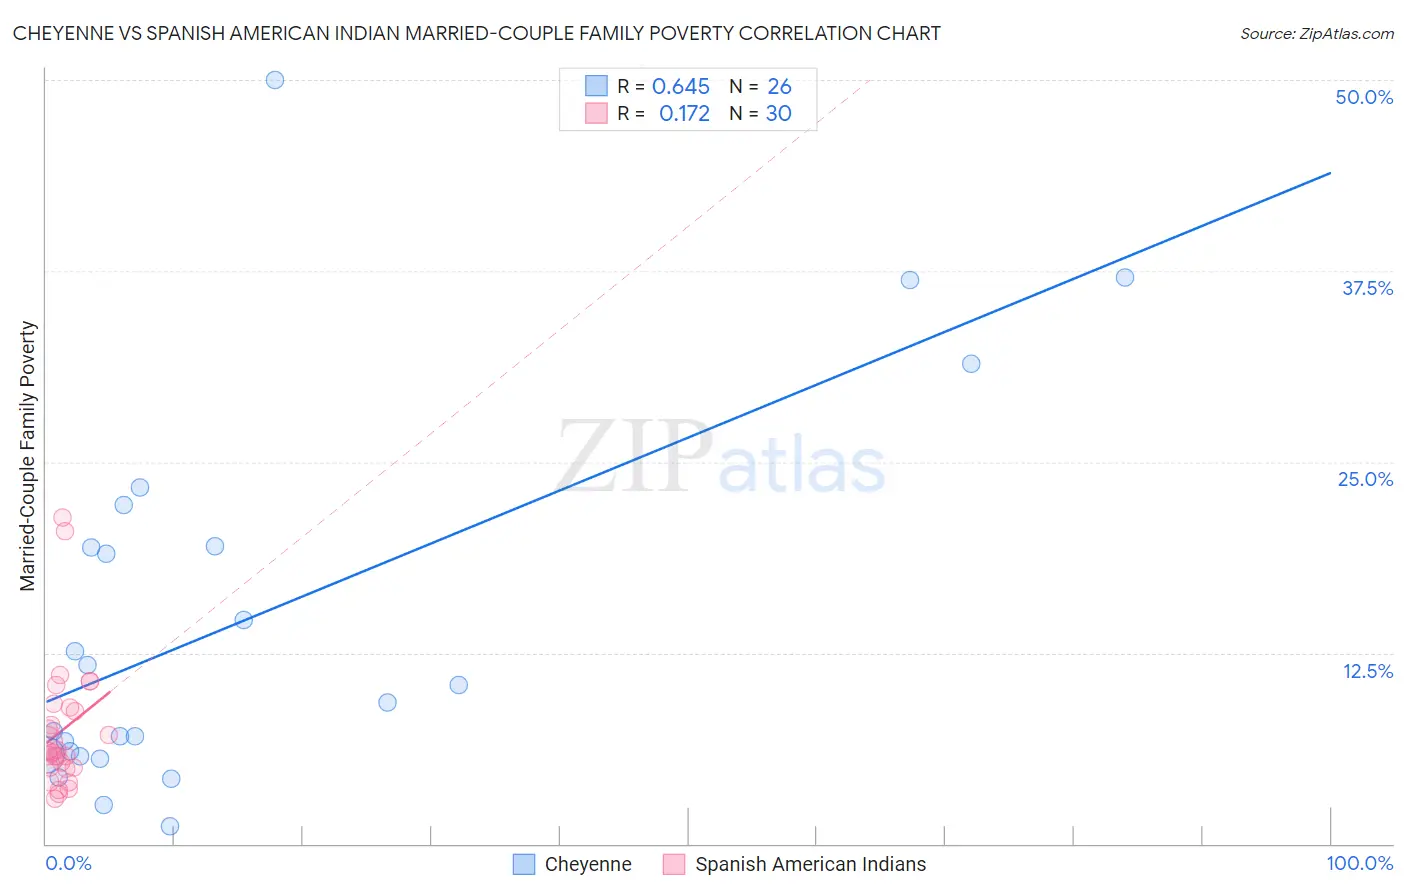
Cheyenne vs Spanish American Indian Married-Couple Family Poverty Correlation Chart
The statistical analysis conducted on geographies consisting of 80,557,927 people shows a significant positive correlation between the proportion of Cheyenne and poverty level among married-couple families in the United States with a correlation coefficient (R) of 0.645 and weighted average of 9.4%. Similarly, the statistical analysis conducted on geographies consisting of 73,069,372 people shows a poor positive correlation between the proportion of Spanish American Indians and poverty level among married-couple families in the United States with a correlation coefficient (R) of 0.172 and weighted average of 7.1%, a difference of 33.8%.
Married-Couple Family Poverty Correlation Summary
| Measurement | Cheyenne | Spanish American Indian |
| Minimum | 1.1% | 3.0% |
| Maximum | 50.0% | 21.3% |
| Range | 48.9% | 18.4% |
| Mean | 14.7% | 7.4% |
| Median | 9.8% | 6.0% |
| Interquartile 25% (IQ1) | 5.8% | 5.0% |
| Interquartile 75% (IQ3) | 19.4% | 8.9% |
| Interquartile Range (IQR) | 13.7% | 3.9% |
| Standard Deviation (Sample) | 12.5% | 4.3% |
| Standard Deviation (Population) | 12.2% | 4.3% |
Similar Demographics by Married-Couple Family Poverty
Demographics Similar to Cheyenne by Married-Couple Family Poverty
In terms of married-couple family poverty, the demographic groups most similar to Cheyenne are Crow (9.6%, a difference of 1.3%), Yuman (9.7%, a difference of 3.2%), Yakama (9.0%, a difference of 5.3%), Apache (9.0%, a difference of 5.4%), and Sioux (8.7%, a difference of 8.5%).
| Demographics | Rating | Rank | Married-Couple Family Poverty |
| Central American Indians | 0.0 /100 | #331 | Tragic 8.3% |
| Dominicans | 0.0 /100 | #332 | Tragic 8.3% |
| Lumbee | 0.0 /100 | #333 | Tragic 8.3% |
| Immigrants | Dominican Republic | 0.0 /100 | #334 | Tragic 8.4% |
| Sioux | 0.0 /100 | #335 | Tragic 8.7% |
| Apache | 0.0 /100 | #336 | Tragic 9.0% |
| Yakama | 0.0 /100 | #337 | Tragic 9.0% |
| Cheyenne | 0.0 /100 | #338 | Tragic 9.4% |
| Crow | 0.0 /100 | #339 | Tragic 9.6% |
| Yuman | 0.0 /100 | #340 | Tragic 9.7% |
| Pueblo | 0.0 /100 | #341 | Tragic 11.1% |
| Tohono O'odham | 0.0 /100 | #342 | Tragic 11.2% |
| Pima | 0.0 /100 | #343 | Tragic 11.4% |
| Navajo | 0.0 /100 | #344 | Tragic 11.9% |
| Puerto Ricans | 0.0 /100 | #345 | Tragic 12.6% |
Demographics Similar to Spanish American Indians by Married-Couple Family Poverty
In terms of married-couple family poverty, the demographic groups most similar to Spanish American Indians are Guatemalan (7.0%, a difference of 0.18%), Hopi (7.1%, a difference of 0.60%), Immigrants from Nicaragua (7.1%, a difference of 0.62%), Immigrants from Dominica (7.1%, a difference of 0.68%), and Immigrants from Armenia (7.1%, a difference of 0.68%).
| Demographics | Rating | Rank | Married-Couple Family Poverty |
| Central Americans | 0.0 /100 | #301 | Tragic 6.7% |
| Immigrants | Ecuador | 0.0 /100 | #302 | Tragic 6.7% |
| Immigrants | El Salvador | 0.0 /100 | #303 | Tragic 6.8% |
| Cubans | 0.0 /100 | #304 | Tragic 6.8% |
| Haitians | 0.0 /100 | #305 | Tragic 6.8% |
| Immigrants | Haiti | 0.0 /100 | #306 | Tragic 7.0% |
| Guatemalans | 0.0 /100 | #307 | Tragic 7.0% |
| Spanish American Indians | 0.0 /100 | #308 | Tragic 7.1% |
| Hopi | 0.0 /100 | #309 | Tragic 7.1% |
| Immigrants | Nicaragua | 0.0 /100 | #310 | Tragic 7.1% |
| Immigrants | Dominica | 0.0 /100 | #311 | Tragic 7.1% |
| Immigrants | Armenia | 0.0 /100 | #312 | Tragic 7.1% |
| Immigrants | St. Vincent and the Grenadines | 0.0 /100 | #313 | Tragic 7.1% |
| British West Indians | 0.0 /100 | #314 | Tragic 7.1% |
| Inupiat | 0.0 /100 | #315 | Tragic 7.1% |