Cheyenne vs Spanish American Indian Cognitive Disability
COMPARE
Cheyenne
Spanish American Indian
Cognitive Disability
Cognitive Disability Comparison
Cheyenne
Spanish American Indians
17.8%
COGNITIVE DISABILITY
1.7/ 100
METRIC RATING
238th/ 347
METRIC RANK
17.8%
COGNITIVE DISABILITY
2.0/ 100
METRIC RATING
235th/ 347
METRIC RANK
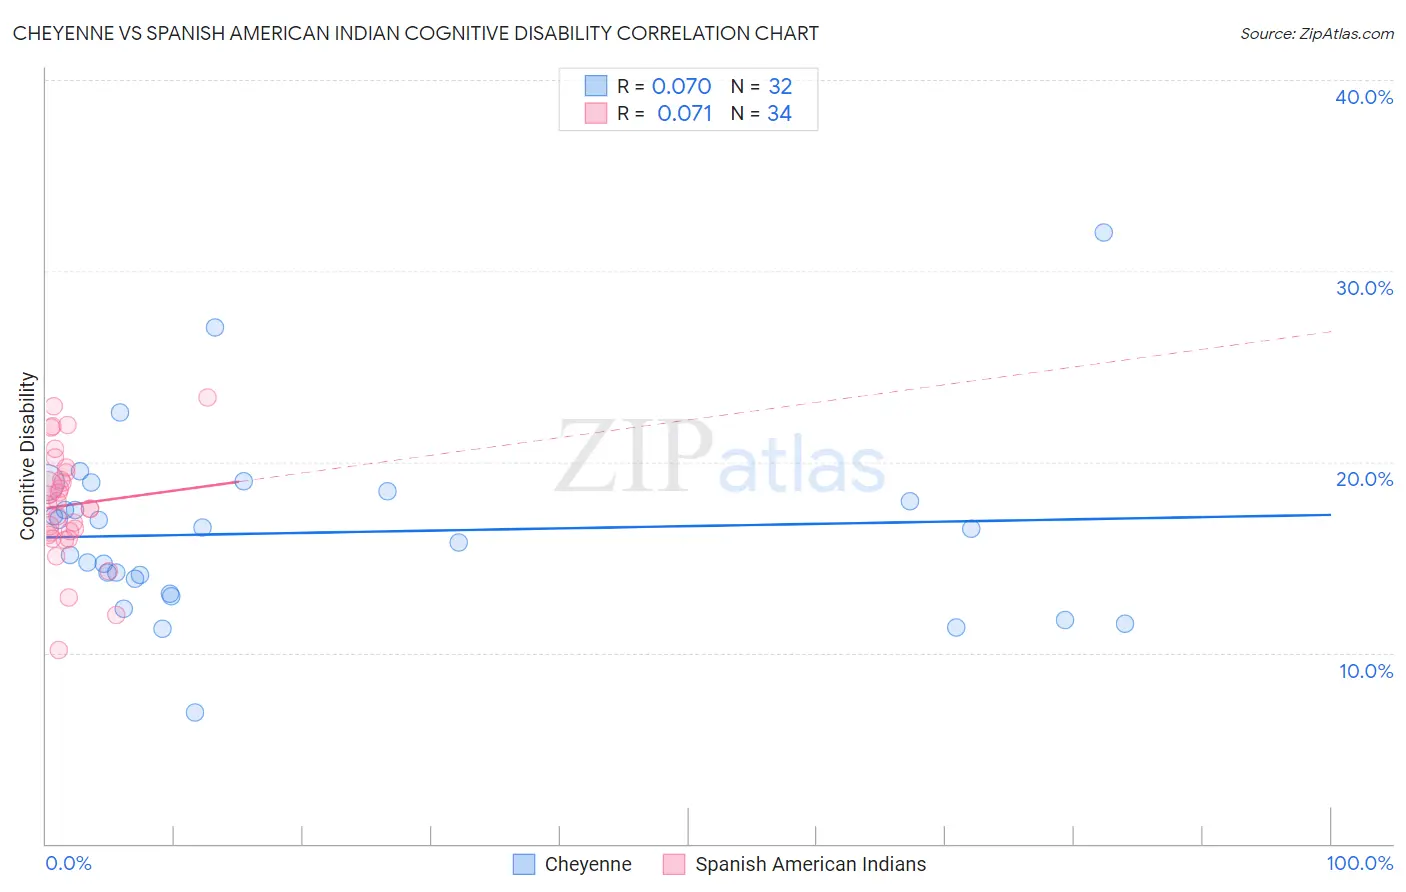
Cheyenne vs Spanish American Indian Cognitive Disability Correlation Chart
The statistical analysis conducted on geographies consisting of 80,710,475 people shows a slight positive correlation between the proportion of Cheyenne and percentage of population with cognitive disability in the United States with a correlation coefficient (R) of 0.070 and weighted average of 17.8%. Similarly, the statistical analysis conducted on geographies consisting of 73,150,113 people shows a slight positive correlation between the proportion of Spanish American Indians and percentage of population with cognitive disability in the United States with a correlation coefficient (R) of 0.071 and weighted average of 17.8%, a difference of 0.10%.
Cognitive Disability Correlation Summary
| Measurement | Cheyenne | Spanish American Indian |
| Minimum | 6.9% | 10.1% |
| Maximum | 32.0% | 23.4% |
| Range | 25.1% | 13.2% |
| Mean | 16.3% | 17.7% |
| Median | 16.2% | 17.6% |
| Interquartile 25% (IQ1) | 13.5% | 16.2% |
| Interquartile 75% (IQ3) | 18.2% | 19.4% |
| Interquartile Range (IQR) | 4.7% | 3.3% |
| Standard Deviation (Sample) | 4.7% | 3.0% |
| Standard Deviation (Population) | 4.6% | 2.9% |
Demographics Similar to Cheyenne and Spanish American Indians by Cognitive Disability
In terms of cognitive disability, the demographic groups most similar to Cheyenne are Immigrants from Iraq (17.8%, a difference of 0.040%), Immigrants from Mexico (17.8%, a difference of 0.040%), Osage (17.8%, a difference of 0.10%), Panamanian (17.8%, a difference of 0.12%), and Guatemalan (17.8%, a difference of 0.13%). Similarly, the demographic groups most similar to Spanish American Indians are Osage (17.8%, a difference of 0.0%), Guatemalan (17.8%, a difference of 0.020%), Tongan (17.8%, a difference of 0.020%), Panamanian (17.8%, a difference of 0.020%), and Mongolian (17.7%, a difference of 0.060%).
| Demographics | Rating | Rank | Cognitive Disability |
| Marshallese | 2.7 /100 | #226 | Tragic 17.7% |
| Immigrants | St. Vincent and the Grenadines | 2.6 /100 | #227 | Tragic 17.7% |
| Immigrants | Central America | 2.3 /100 | #228 | Tragic 17.7% |
| Immigrants | Guatemala | 2.2 /100 | #229 | Tragic 17.7% |
| Mongolians | 2.2 /100 | #230 | Tragic 17.7% |
| Guatemalans | 2.1 /100 | #231 | Tragic 17.8% |
| Tongans | 2.1 /100 | #232 | Tragic 17.8% |
| Panamanians | 2.1 /100 | #233 | Tragic 17.8% |
| Osage | 2.0 /100 | #234 | Tragic 17.8% |
| Spanish American Indians | 2.0 /100 | #235 | Tragic 17.8% |
| Immigrants | Iraq | 1.8 /100 | #236 | Tragic 17.8% |
| Immigrants | Mexico | 1.8 /100 | #237 | Tragic 17.8% |
| Cheyenne | 1.7 /100 | #238 | Tragic 17.8% |
| Cajuns | 1.4 /100 | #239 | Tragic 17.8% |
| Iraqis | 1.4 /100 | #240 | Tragic 17.8% |
| Mexicans | 1.1 /100 | #241 | Tragic 17.8% |
| Paiute | 1.1 /100 | #242 | Tragic 17.8% |
| Immigrants | Bangladesh | 1.0 /100 | #243 | Tragic 17.8% |
| Jamaicans | 0.9 /100 | #244 | Tragic 17.9% |
| Trinidadians and Tobagonians | 0.8 /100 | #245 | Tragic 17.9% |
| Immigrants | Thailand | 0.8 /100 | #246 | Tragic 17.9% |