Black/African American vs Immigrants from Kazakhstan Single Father Poverty
COMPARE
Black/African American
Immigrants from Kazakhstan
Single Father Poverty
Single Father Poverty Comparison
Blacks/African Americans
Immigrants from Kazakhstan
20.4%
SINGLE FATHER POVERTY
0.0/ 100
METRIC RATING
325th/ 347
METRIC RANK
15.6%
SINGLE FATHER POVERTY
98.2/ 100
METRIC RATING
95th/ 347
METRIC RANK
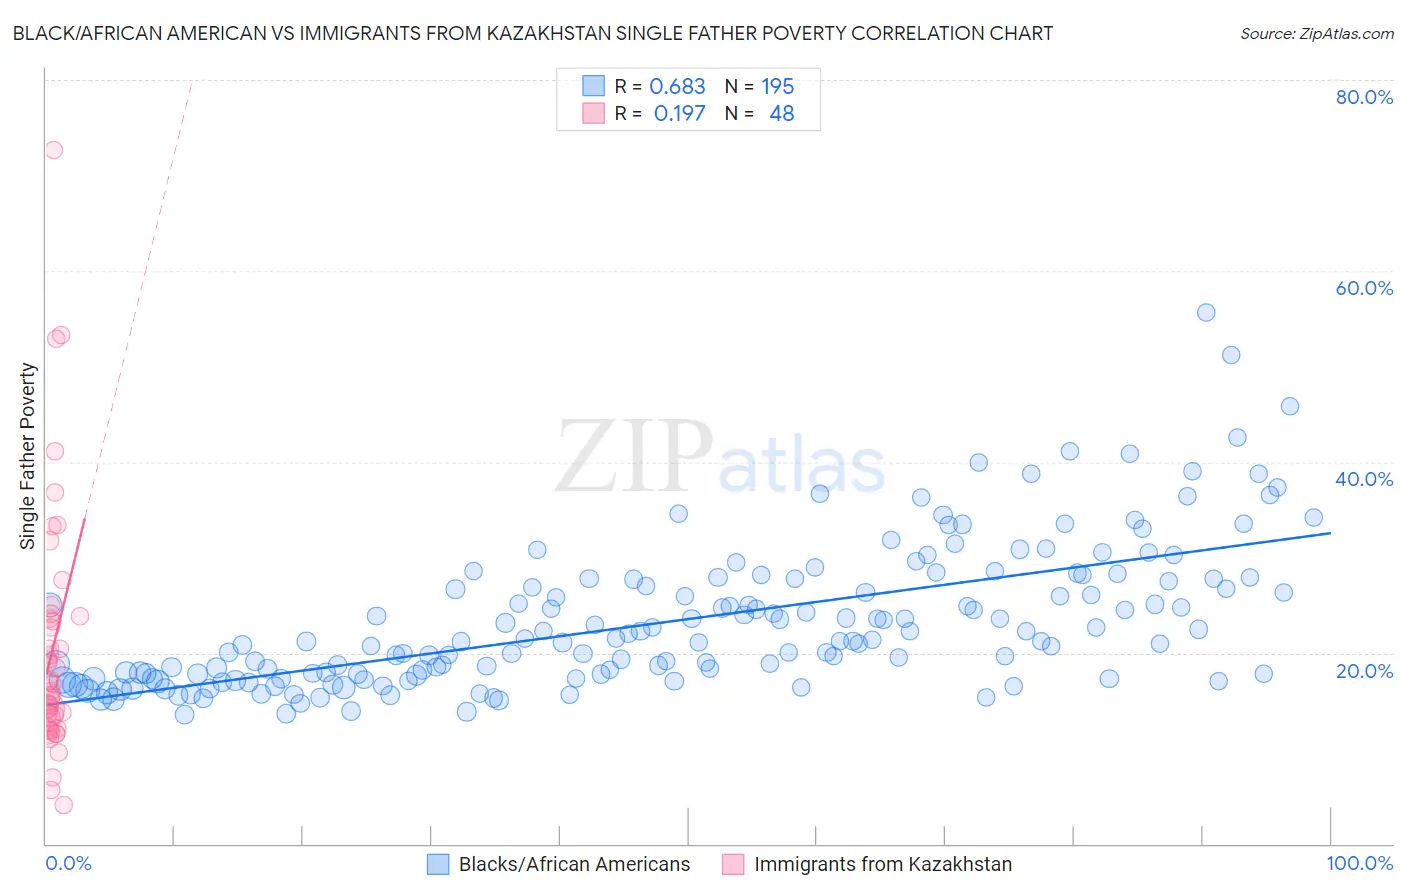
Black/African American vs Immigrants from Kazakhstan Single Father Poverty Correlation Chart
The statistical analysis conducted on geographies consisting of 410,273,271 people shows a significant positive correlation between the proportion of Blacks/African Americans and poverty level among single fathers in the United States with a correlation coefficient (R) of 0.683 and weighted average of 20.4%. Similarly, the statistical analysis conducted on geographies consisting of 108,344,450 people shows a poor positive correlation between the proportion of Immigrants from Kazakhstan and poverty level among single fathers in the United States with a correlation coefficient (R) of 0.197 and weighted average of 15.6%, a difference of 30.8%.
Single Father Poverty Correlation Summary
| Measurement | Black/African American | Immigrants from Kazakhstan |
| Minimum | 13.5% | 4.0% |
| Maximum | 55.6% | 72.7% |
| Range | 42.1% | 68.7% |
| Mean | 23.3% | 20.5% |
| Median | 21.3% | 16.4% |
| Interquartile 25% (IQ1) | 17.6% | 12.7% |
| Interquartile 75% (IQ3) | 27.7% | 23.7% |
| Interquartile Range (IQR) | 10.1% | 11.0% |
| Standard Deviation (Sample) | 7.4% | 13.1% |
| Standard Deviation (Population) | 7.4% | 12.9% |
Similar Demographics by Single Father Poverty
Demographics Similar to Blacks/African Americans by Single Father Poverty
In terms of single father poverty, the demographic groups most similar to Blacks/African Americans are Immigrants from Yemen (20.6%, a difference of 1.0%), American (20.1%, a difference of 1.6%), Choctaw (20.7%, a difference of 1.7%), Pennsylvania German (20.0%, a difference of 1.8%), and Creek (19.8%, a difference of 2.7%).
| Demographics | Rating | Rank | Single Father Poverty |
| Dutch West Indians | 0.0 /100 | #318 | Tragic 19.2% |
| Slovaks | 0.0 /100 | #319 | Tragic 19.3% |
| Inupiat | 0.0 /100 | #320 | Tragic 19.5% |
| Cherokee | 0.0 /100 | #321 | Tragic 19.6% |
| Creek | 0.0 /100 | #322 | Tragic 19.8% |
| Pennsylvania Germans | 0.0 /100 | #323 | Tragic 20.0% |
| Americans | 0.0 /100 | #324 | Tragic 20.1% |
| Blacks/African Americans | 0.0 /100 | #325 | Tragic 20.4% |
| Immigrants | Yemen | 0.0 /100 | #326 | Tragic 20.6% |
| Choctaw | 0.0 /100 | #327 | Tragic 20.7% |
| Pueblo | 0.0 /100 | #328 | Tragic 21.1% |
| Colville | 0.0 /100 | #329 | Tragic 21.4% |
| Paiute | 0.0 /100 | #330 | Tragic 21.6% |
| Central American Indians | 0.0 /100 | #331 | Tragic 21.7% |
| Tohono O'odham | 0.0 /100 | #332 | Tragic 22.0% |
Demographics Similar to Immigrants from Kazakhstan by Single Father Poverty
In terms of single father poverty, the demographic groups most similar to Immigrants from Kazakhstan are Immigrants from Belgium (15.6%, a difference of 0.010%), Yaqui (15.6%, a difference of 0.020%), Zimbabwean (15.6%, a difference of 0.030%), Immigrants from Uruguay (15.6%, a difference of 0.050%), and Basque (15.5%, a difference of 0.19%).
| Demographics | Rating | Rank | Single Father Poverty |
| Burmese | 99.0 /100 | #88 | Exceptional 15.5% |
| Immigrants | Korea | 99.0 /100 | #89 | Exceptional 15.5% |
| Mexican American Indians | 98.7 /100 | #90 | Exceptional 15.5% |
| Immigrants | Romania | 98.6 /100 | #91 | Exceptional 15.5% |
| Immigrants | Serbia | 98.5 /100 | #92 | Exceptional 15.5% |
| Basques | 98.4 /100 | #93 | Exceptional 15.5% |
| Immigrants | Uruguay | 98.2 /100 | #94 | Exceptional 15.6% |
| Immigrants | Kazakhstan | 98.2 /100 | #95 | Exceptional 15.6% |
| Immigrants | Belgium | 98.1 /100 | #96 | Exceptional 15.6% |
| Yaqui | 98.1 /100 | #97 | Exceptional 15.6% |
| Zimbabweans | 98.1 /100 | #98 | Exceptional 15.6% |
| Immigrants | Middle Africa | 97.4 /100 | #99 | Exceptional 15.6% |
| Immigrants | Chile | 96.9 /100 | #100 | Exceptional 15.7% |
| Fijians | 96.8 /100 | #101 | Exceptional 15.7% |
| Chileans | 96.4 /100 | #102 | Exceptional 15.7% |