Black/African American vs Arab Single Father Poverty
COMPARE
Black/African American
Arab
Single Father Poverty
Single Father Poverty Comparison
Blacks/African Americans
Arabs
20.4%
SINGLE FATHER POVERTY
0.0/ 100
METRIC RATING
325th/ 347
METRIC RANK
16.6%
SINGLE FATHER POVERTY
12.8/ 100
METRIC RATING
211th/ 347
METRIC RANK
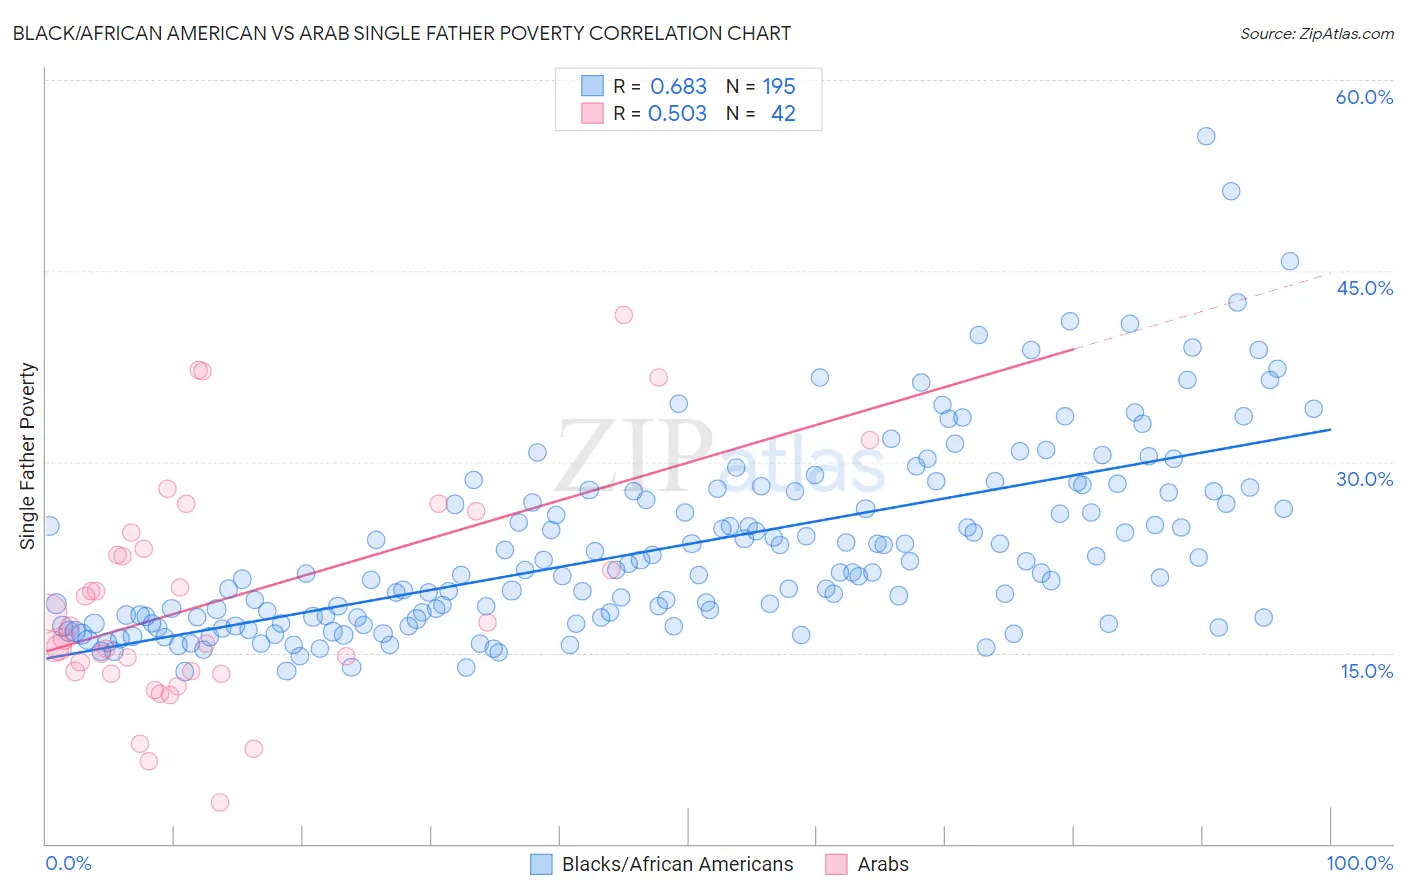
Black/African American vs Arab Single Father Poverty Correlation Chart
The statistical analysis conducted on geographies consisting of 410,273,271 people shows a significant positive correlation between the proportion of Blacks/African Americans and poverty level among single fathers in the United States with a correlation coefficient (R) of 0.683 and weighted average of 20.4%. Similarly, the statistical analysis conducted on geographies consisting of 369,349,186 people shows a substantial positive correlation between the proportion of Arabs and poverty level among single fathers in the United States with a correlation coefficient (R) of 0.503 and weighted average of 16.6%, a difference of 22.5%.
Single Father Poverty Correlation Summary
| Measurement | Black/African American | Arab |
| Minimum | 13.5% | 3.2% |
| Maximum | 55.6% | 41.6% |
| Range | 42.1% | 38.4% |
| Mean | 23.3% | 19.1% |
| Median | 21.3% | 16.6% |
| Interquartile 25% (IQ1) | 17.6% | 13.5% |
| Interquartile 75% (IQ3) | 27.7% | 23.1% |
| Interquartile Range (IQR) | 10.1% | 9.6% |
| Standard Deviation (Sample) | 7.4% | 8.7% |
| Standard Deviation (Population) | 7.4% | 8.6% |
Similar Demographics by Single Father Poverty
Demographics Similar to Blacks/African Americans by Single Father Poverty
In terms of single father poverty, the demographic groups most similar to Blacks/African Americans are Immigrants from Yemen (20.6%, a difference of 1.0%), American (20.1%, a difference of 1.6%), Choctaw (20.7%, a difference of 1.7%), Pennsylvania German (20.0%, a difference of 1.8%), and Creek (19.8%, a difference of 2.7%).
| Demographics | Rating | Rank | Single Father Poverty |
| Dutch West Indians | 0.0 /100 | #318 | Tragic 19.2% |
| Slovaks | 0.0 /100 | #319 | Tragic 19.3% |
| Inupiat | 0.0 /100 | #320 | Tragic 19.5% |
| Cherokee | 0.0 /100 | #321 | Tragic 19.6% |
| Creek | 0.0 /100 | #322 | Tragic 19.8% |
| Pennsylvania Germans | 0.0 /100 | #323 | Tragic 20.0% |
| Americans | 0.0 /100 | #324 | Tragic 20.1% |
| Blacks/African Americans | 0.0 /100 | #325 | Tragic 20.4% |
| Immigrants | Yemen | 0.0 /100 | #326 | Tragic 20.6% |
| Choctaw | 0.0 /100 | #327 | Tragic 20.7% |
| Pueblo | 0.0 /100 | #328 | Tragic 21.1% |
| Colville | 0.0 /100 | #329 | Tragic 21.4% |
| Paiute | 0.0 /100 | #330 | Tragic 21.6% |
| Central American Indians | 0.0 /100 | #331 | Tragic 21.7% |
| Tohono O'odham | 0.0 /100 | #332 | Tragic 22.0% |
Demographics Similar to Arabs by Single Father Poverty
In terms of single father poverty, the demographic groups most similar to Arabs are Guatemalan (16.6%, a difference of 0.0%), European (16.6%, a difference of 0.030%), Immigrants from Senegal (16.6%, a difference of 0.080%), New Zealander (16.6%, a difference of 0.080%), and Eastern European (16.6%, a difference of 0.080%).
| Demographics | Rating | Rank | Single Father Poverty |
| Immigrants | Guatemala | 14.8 /100 | #204 | Poor 16.6% |
| Venezuelans | 14.3 /100 | #205 | Poor 16.6% |
| Immigrants | Senegal | 13.7 /100 | #206 | Poor 16.6% |
| New Zealanders | 13.7 /100 | #207 | Poor 16.6% |
| Eastern Europeans | 13.7 /100 | #208 | Poor 16.6% |
| Europeans | 13.2 /100 | #209 | Poor 16.6% |
| Guatemalans | 12.9 /100 | #210 | Poor 16.6% |
| Arabs | 12.8 /100 | #211 | Poor 16.6% |
| Immigrants | Southern Europe | 11.2 /100 | #212 | Poor 16.7% |
| Ghanaians | 11.0 /100 | #213 | Poor 16.7% |
| Spanish | 10.7 /100 | #214 | Poor 16.7% |
| Immigrants | Scotland | 9.6 /100 | #215 | Tragic 16.7% |
| Immigrants | England | 9.5 /100 | #216 | Tragic 16.7% |
| Cheyenne | 9.3 /100 | #217 | Tragic 16.7% |
| Immigrants | Uganda | 8.6 /100 | #218 | Tragic 16.7% |