Ecuadorian vs Arab Single Father Poverty
COMPARE
Ecuadorian
Arab
Single Father Poverty
Single Father Poverty Comparison
Ecuadorians
Arabs
16.5%
SINGLE FATHER POVERTY
24.5/ 100
METRIC RATING
193rd/ 347
METRIC RANK
16.6%
SINGLE FATHER POVERTY
12.8/ 100
METRIC RATING
211th/ 347
METRIC RANK
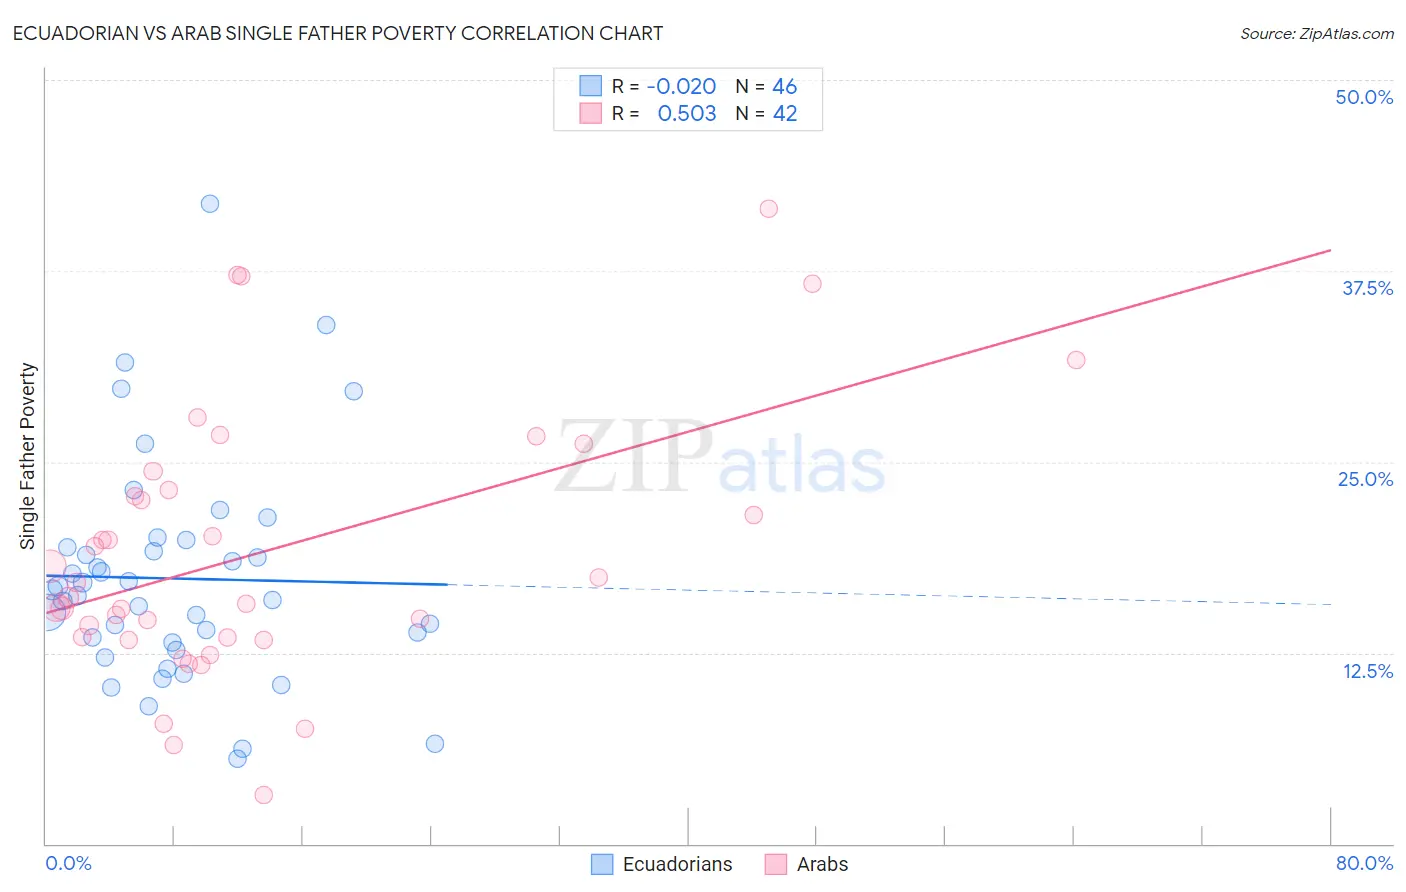
Ecuadorian vs Arab Single Father Poverty Correlation Chart
The statistical analysis conducted on geographies consisting of 258,169,372 people shows no correlation between the proportion of Ecuadorians and poverty level among single fathers in the United States with a correlation coefficient (R) of -0.020 and weighted average of 16.5%. Similarly, the statistical analysis conducted on geographies consisting of 369,349,186 people shows a substantial positive correlation between the proportion of Arabs and poverty level among single fathers in the United States with a correlation coefficient (R) of 0.503 and weighted average of 16.6%, a difference of 0.86%.
Single Father Poverty Correlation Summary
| Measurement | Ecuadorian | Arab |
| Minimum | 5.6% | 3.2% |
| Maximum | 41.9% | 41.6% |
| Range | 36.3% | 38.4% |
| Mean | 17.4% | 19.1% |
| Median | 16.4% | 16.6% |
| Interquartile 25% (IQ1) | 13.2% | 13.5% |
| Interquartile 75% (IQ3) | 19.4% | 23.1% |
| Interquartile Range (IQR) | 6.2% | 9.6% |
| Standard Deviation (Sample) | 7.2% | 8.7% |
| Standard Deviation (Population) | 7.2% | 8.6% |
Demographics Similar to Ecuadorians and Arabs by Single Father Poverty
In terms of single father poverty, the demographic groups most similar to Ecuadorians are Immigrants from Switzerland (16.5%, a difference of 0.010%), Cape Verdean (16.5%, a difference of 0.010%), Immigrants from Barbados (16.5%, a difference of 0.010%), Immigrants from Canada (16.5%, a difference of 0.16%), and Immigrants from Northern Europe (16.5%, a difference of 0.27%). Similarly, the demographic groups most similar to Arabs are Guatemalan (16.6%, a difference of 0.0%), European (16.6%, a difference of 0.030%), Immigrants from Senegal (16.6%, a difference of 0.080%), New Zealander (16.6%, a difference of 0.080%), and Eastern European (16.6%, a difference of 0.080%).
| Demographics | Rating | Rank | Single Father Poverty |
| Immigrants | Switzerland | 24.8 /100 | #192 | Fair 16.5% |
| Ecuadorians | 24.5 /100 | #193 | Fair 16.5% |
| Cape Verdeans | 24.4 /100 | #194 | Fair 16.5% |
| Immigrants | Barbados | 24.3 /100 | #195 | Fair 16.5% |
| Immigrants | Canada | 21.9 /100 | #196 | Fair 16.5% |
| Immigrants | Northern Europe | 20.3 /100 | #197 | Fair 16.5% |
| Romanians | 20.1 /100 | #198 | Fair 16.5% |
| Immigrants | Belize | 19.8 /100 | #199 | Poor 16.5% |
| Syrians | 17.4 /100 | #200 | Poor 16.6% |
| Cubans | 16.5 /100 | #201 | Poor 16.6% |
| Immigrants | Croatia | 16.5 /100 | #202 | Poor 16.6% |
| Immigrants | North America | 15.1 /100 | #203 | Poor 16.6% |
| Immigrants | Guatemala | 14.8 /100 | #204 | Poor 16.6% |
| Venezuelans | 14.3 /100 | #205 | Poor 16.6% |
| Immigrants | Senegal | 13.7 /100 | #206 | Poor 16.6% |
| New Zealanders | 13.7 /100 | #207 | Poor 16.6% |
| Eastern Europeans | 13.7 /100 | #208 | Poor 16.6% |
| Europeans | 13.2 /100 | #209 | Poor 16.6% |
| Guatemalans | 12.9 /100 | #210 | Poor 16.6% |
| Arabs | 12.8 /100 | #211 | Poor 16.6% |
| Immigrants | Southern Europe | 11.2 /100 | #212 | Poor 16.7% |