Central American vs Arab Single Father Poverty
COMPARE
Central American
Arab
Single Father Poverty
Single Father Poverty Comparison
Central Americans
Arabs
16.0%
SINGLE FATHER POVERTY
87.1/ 100
METRIC RATING
138th/ 347
METRIC RANK
16.6%
SINGLE FATHER POVERTY
12.8/ 100
METRIC RATING
211th/ 347
METRIC RANK
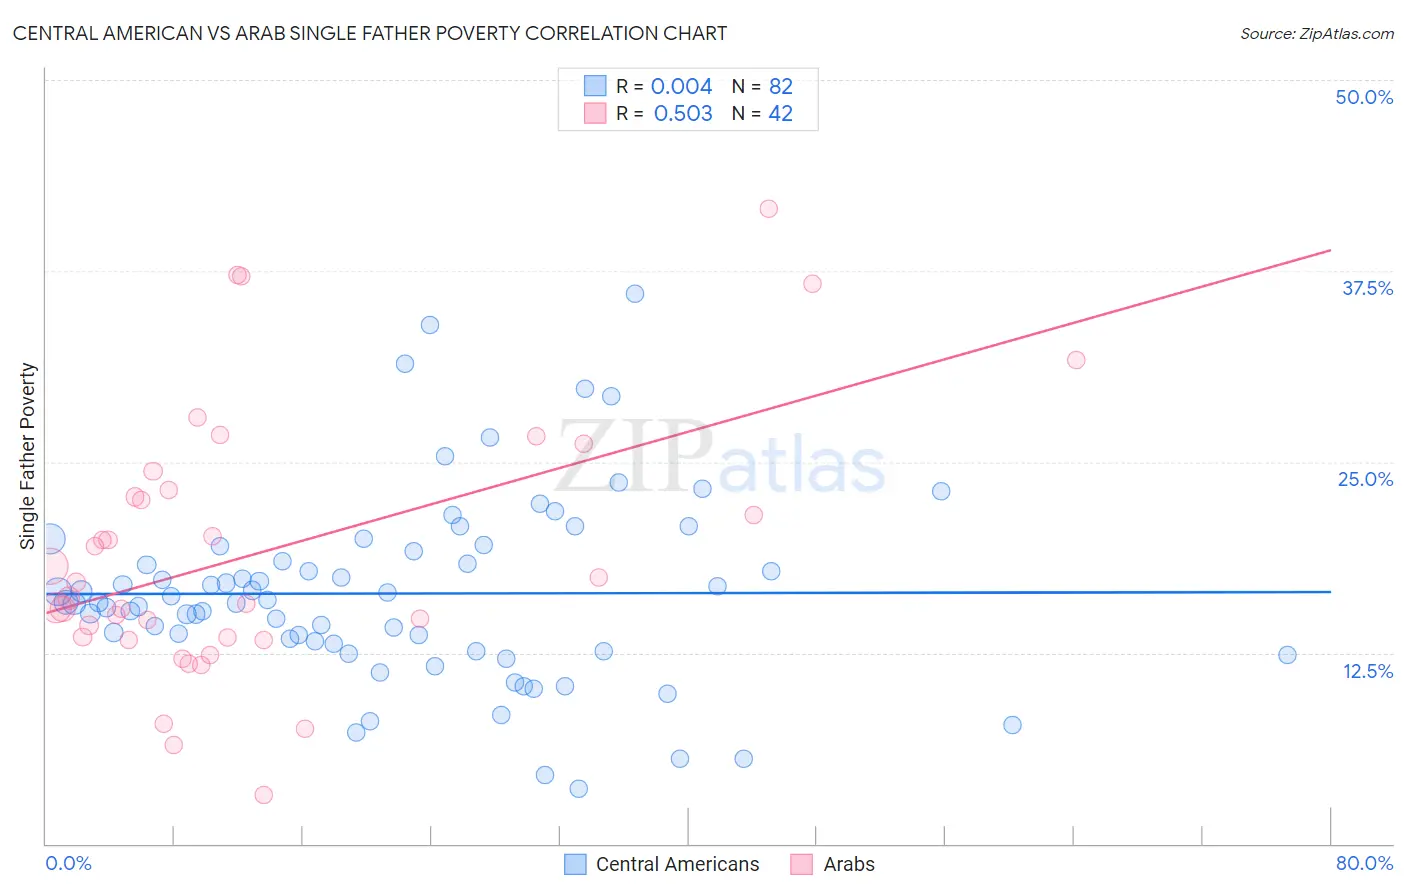
Central American vs Arab Single Father Poverty Correlation Chart
The statistical analysis conducted on geographies consisting of 382,583,767 people shows no correlation between the proportion of Central Americans and poverty level among single fathers in the United States with a correlation coefficient (R) of 0.004 and weighted average of 16.0%. Similarly, the statistical analysis conducted on geographies consisting of 369,349,186 people shows a substantial positive correlation between the proportion of Arabs and poverty level among single fathers in the United States with a correlation coefficient (R) of 0.503 and weighted average of 16.6%, a difference of 4.3%.
Single Father Poverty Correlation Summary
| Measurement | Central American | Arab |
| Minimum | 3.6% | 3.2% |
| Maximum | 36.0% | 41.6% |
| Range | 32.4% | 38.4% |
| Mean | 16.4% | 19.1% |
| Median | 15.8% | 16.6% |
| Interquartile 25% (IQ1) | 13.1% | 13.5% |
| Interquartile 75% (IQ3) | 19.1% | 23.1% |
| Interquartile Range (IQR) | 6.0% | 9.6% |
| Standard Deviation (Sample) | 6.1% | 8.7% |
| Standard Deviation (Population) | 6.1% | 8.6% |
Similar Demographics by Single Father Poverty
Demographics Similar to Central Americans by Single Father Poverty
In terms of single father poverty, the demographic groups most similar to Central Americans are Immigrants from the Azores (15.9%, a difference of 0.010%), Cypriot (15.9%, a difference of 0.040%), Immigrants from Sri Lanka (15.9%, a difference of 0.11%), South American (16.0%, a difference of 0.12%), and Immigrants from South America (15.9%, a difference of 0.14%).
| Demographics | Rating | Rank | Single Father Poverty |
| Nicaraguans | 90.1 /100 | #131 | Exceptional 15.9% |
| Immigrants | Portugal | 89.7 /100 | #132 | Excellent 15.9% |
| Immigrants | Syria | 89.5 /100 | #133 | Excellent 15.9% |
| Immigrants | South America | 88.5 /100 | #134 | Excellent 15.9% |
| Immigrants | Sri Lanka | 88.2 /100 | #135 | Excellent 15.9% |
| Cypriots | 87.5 /100 | #136 | Excellent 15.9% |
| Immigrants | Azores | 87.2 /100 | #137 | Excellent 15.9% |
| Central Americans | 87.1 /100 | #138 | Excellent 16.0% |
| South Americans | 85.9 /100 | #139 | Excellent 16.0% |
| Immigrants | Netherlands | 85.3 /100 | #140 | Excellent 16.0% |
| Liberians | 83.3 /100 | #141 | Excellent 16.0% |
| Immigrants | Mexico | 83.3 /100 | #142 | Excellent 16.0% |
| Immigrants | Central America | 83.1 /100 | #143 | Excellent 16.0% |
| Immigrants | Kuwait | 81.4 /100 | #144 | Excellent 16.0% |
| Immigrants | Western Asia | 80.7 /100 | #145 | Excellent 16.0% |
Demographics Similar to Arabs by Single Father Poverty
In terms of single father poverty, the demographic groups most similar to Arabs are Guatemalan (16.6%, a difference of 0.0%), European (16.6%, a difference of 0.030%), Immigrants from Senegal (16.6%, a difference of 0.080%), New Zealander (16.6%, a difference of 0.080%), and Eastern European (16.6%, a difference of 0.080%).
| Demographics | Rating | Rank | Single Father Poverty |
| Immigrants | Guatemala | 14.8 /100 | #204 | Poor 16.6% |
| Venezuelans | 14.3 /100 | #205 | Poor 16.6% |
| Immigrants | Senegal | 13.7 /100 | #206 | Poor 16.6% |
| New Zealanders | 13.7 /100 | #207 | Poor 16.6% |
| Eastern Europeans | 13.7 /100 | #208 | Poor 16.6% |
| Europeans | 13.2 /100 | #209 | Poor 16.6% |
| Guatemalans | 12.9 /100 | #210 | Poor 16.6% |
| Arabs | 12.8 /100 | #211 | Poor 16.6% |
| Immigrants | Southern Europe | 11.2 /100 | #212 | Poor 16.7% |
| Ghanaians | 11.0 /100 | #213 | Poor 16.7% |
| Spanish | 10.7 /100 | #214 | Poor 16.7% |
| Immigrants | Scotland | 9.6 /100 | #215 | Tragic 16.7% |
| Immigrants | England | 9.5 /100 | #216 | Tragic 16.7% |
| Cheyenne | 9.3 /100 | #217 | Tragic 16.7% |
| Immigrants | Uganda | 8.6 /100 | #218 | Tragic 16.7% |