Blackfeet vs Tsimshian Female Poverty
COMPARE
Blackfeet
Tsimshian
Female Poverty
Female Poverty Comparison
Blackfeet
Tsimshian
16.4%
FEMALE POVERTY
0.0/ 100
METRIC RATING
289th/ 347
METRIC RANK
13.1%
FEMALE POVERTY
75.5/ 100
METRIC RATING
150th/ 347
METRIC RANK
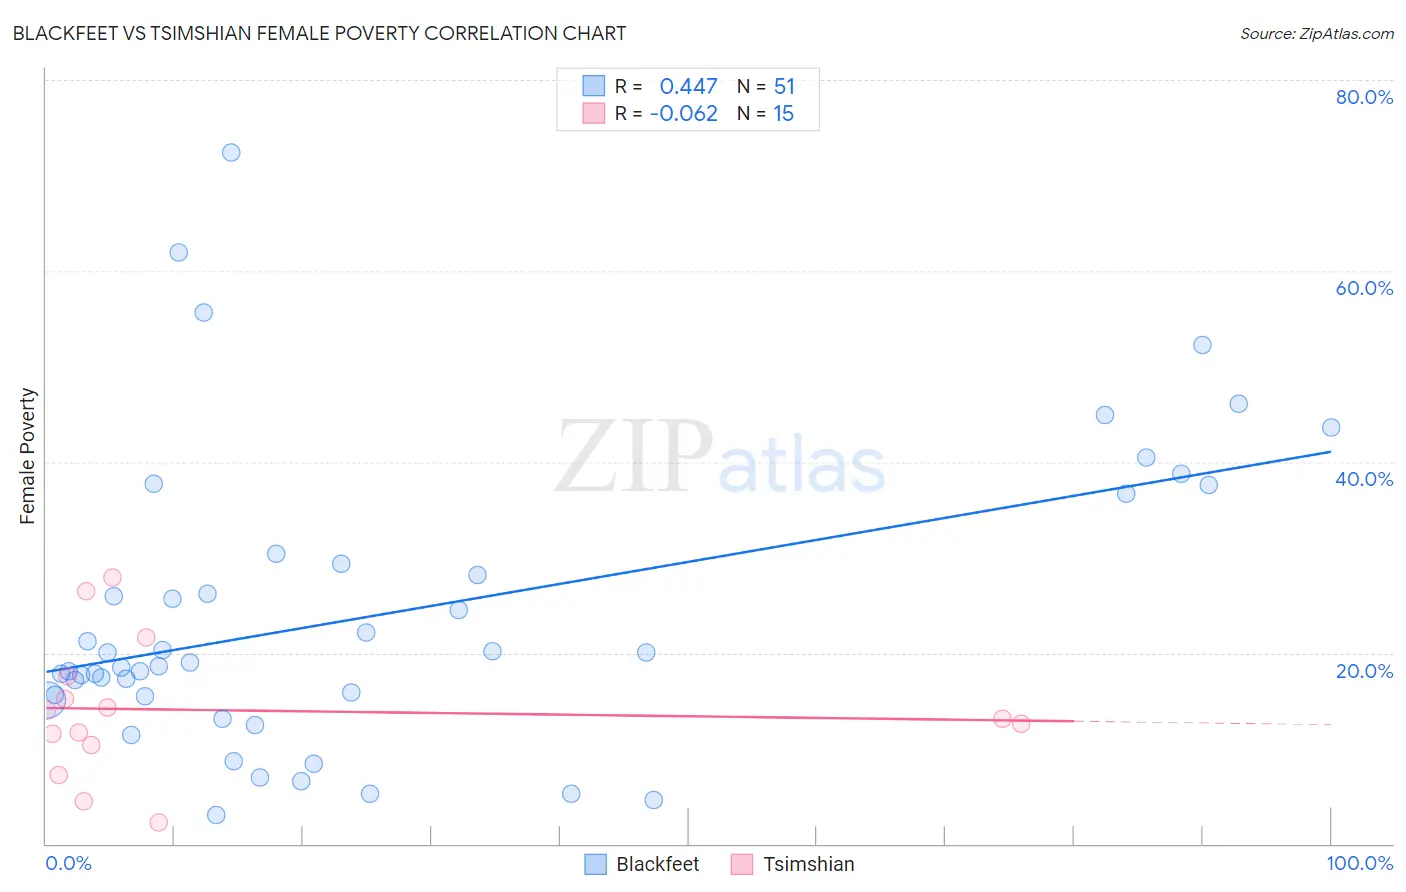
Blackfeet vs Tsimshian Female Poverty Correlation Chart
The statistical analysis conducted on geographies consisting of 309,450,114 people shows a moderate positive correlation between the proportion of Blackfeet and poverty level among females in the United States with a correlation coefficient (R) of 0.447 and weighted average of 16.4%. Similarly, the statistical analysis conducted on geographies consisting of 15,626,462 people shows a slight negative correlation between the proportion of Tsimshian and poverty level among females in the United States with a correlation coefficient (R) of -0.062 and weighted average of 13.1%, a difference of 25.1%.
Female Poverty Correlation Summary
| Measurement | Blackfeet | Tsimshian |
| Minimum | 3.0% | 2.2% |
| Maximum | 72.4% | 27.8% |
| Range | 69.4% | 25.6% |
| Mean | 24.1% | 14.0% |
| Median | 19.0% | 13.1% |
| Interquartile 25% (IQ1) | 15.5% | 10.4% |
| Interquartile 75% (IQ3) | 30.4% | 17.6% |
| Interquartile Range (IQR) | 14.9% | 7.2% |
| Standard Deviation (Sample) | 15.4% | 7.2% |
| Standard Deviation (Population) | 15.2% | 6.9% |
Similar Demographics by Female Poverty
Demographics Similar to Blackfeet by Female Poverty
In terms of female poverty, the demographic groups most similar to Blackfeet are Indonesian (16.4%, a difference of 0.010%), Immigrants from Bangladesh (16.4%, a difference of 0.19%), Yaqui (16.4%, a difference of 0.36%), Immigrants from Zaire (16.4%, a difference of 0.37%), and Immigrants from Latin America (16.4%, a difference of 0.42%).
| Demographics | Rating | Rank | Female Poverty |
| Immigrants | Haiti | 0.0 /100 | #282 | Tragic 16.1% |
| Immigrants | Cuba | 0.0 /100 | #283 | Tragic 16.1% |
| Spanish Americans | 0.0 /100 | #284 | Tragic 16.2% |
| Comanche | 0.0 /100 | #285 | Tragic 16.2% |
| Inupiat | 0.0 /100 | #286 | Tragic 16.2% |
| Immigrants | Belize | 0.0 /100 | #287 | Tragic 16.3% |
| Indonesians | 0.0 /100 | #288 | Tragic 16.4% |
| Blackfeet | 0.0 /100 | #289 | Tragic 16.4% |
| Immigrants | Bangladesh | 0.0 /100 | #290 | Tragic 16.4% |
| Yaqui | 0.0 /100 | #291 | Tragic 16.4% |
| Immigrants | Zaire | 0.0 /100 | #292 | Tragic 16.4% |
| Immigrants | Latin America | 0.0 /100 | #293 | Tragic 16.4% |
| Immigrants | Cabo Verde | 0.0 /100 | #294 | Tragic 16.4% |
| Senegalese | 0.0 /100 | #295 | Tragic 16.5% |
| Immigrants | Senegal | 0.0 /100 | #296 | Tragic 16.5% |
Demographics Similar to Tsimshian by Female Poverty
In terms of female poverty, the demographic groups most similar to Tsimshian are Taiwanese (13.1%, a difference of 0.030%), Immigrants from Germany (13.1%, a difference of 0.070%), Yugoslavian (13.1%, a difference of 0.19%), Samoan (13.1%, a difference of 0.24%), and Immigrants from Kazakhstan (13.0%, a difference of 0.44%).
| Demographics | Rating | Rank | Female Poverty |
| Immigrants | Malaysia | 80.4 /100 | #143 | Excellent 13.0% |
| Afghans | 79.8 /100 | #144 | Good 13.0% |
| Syrians | 79.6 /100 | #145 | Good 13.0% |
| Immigrants | Peru | 79.1 /100 | #146 | Good 13.0% |
| Immigrants | Kazakhstan | 78.6 /100 | #147 | Good 13.0% |
| Yugoslavians | 76.9 /100 | #148 | Good 13.1% |
| Taiwanese | 75.7 /100 | #149 | Good 13.1% |
| Tsimshian | 75.5 /100 | #150 | Good 13.1% |
| Immigrants | Germany | 74.9 /100 | #151 | Good 13.1% |
| Samoans | 73.6 /100 | #152 | Good 13.1% |
| Immigrants | Fiji | 71.0 /100 | #153 | Good 13.2% |
| Armenians | 70.4 /100 | #154 | Good 13.2% |
| Hungarians | 70.1 /100 | #155 | Good 13.2% |
| Immigrants | Bosnia and Herzegovina | 69.7 /100 | #156 | Good 13.2% |
| Immigrants | Northern Africa | 68.8 /100 | #157 | Good 13.2% |