Blackfeet vs Immigrants from Pakistan Female Poverty

COMPARE

Blackfeet
Race
Ancestry
AfghanAfricanAlaska NativeAlaskan AthabascanAlbanianAleutAlsatianAmericanApacheArabArapahoArgentineanArmenianAssyrian/Chaldean/SyriacAustralianAustrianBahamianBangladeshiBarbadianBasqueBelgianBelizeanBermudanBhutaneseBlackfeetBolivianBrazilianBritishBritish West IndianBulgarianBurmeseCajunCambodianCanadianCape VerdeanCarpatho RusynCelticCentral AmericanCentral American IndianCherokeeCheyenneChickasawChileanChineseChippewaChoctawColombianColvilleComancheCosta RicanCreeCreekCroatianCrowCubanCypriotCzechCzechoslovakianDanishDelawareDominicanDutchDutch West IndianEastern EuropeanEcuadorianEgyptianEnglishEstonianEthiopianEuropeanFijianFilipinoFinnishFrenchFrench American IndianFrench CanadianGermanGerman RussianGhanaianGreekGuamanian/ChamorroGuatemalanGuyaneseHaitianHmongHonduranHopiHoumaHungarianIcelanderIndian (Asian)IndonesianInupiatIranianIraqiIrishIroquoisIsraeliItalianJamaicanJapaneseJordanianKenyanKiowaKoreanLaotianLatvianLebaneseLiberianLithuanianLumbeeLuxembourgerMacedonianMalaysianMalteseMarshalleseMenomineeMexicanMexican American IndianMongolianMoroccanNative HawaiianNavajoNepaleseNew ZealanderNicaraguanNigerianNorthern EuropeanNorwegianOkinawanOsageOttawaPaiutePakistaniPalestinianPanamanianParaguayanPennsylvania GermanPeruvianPimaPolishPortuguesePotawatomiPuebloPuerto RicanPuget Sound SalishRomanianRussianSalvadoranSamoanScandinavianScotch-IrishScottishSeminoleSenegaleseSerbianShoshoneSierra LeoneanSiouxSlavicSlovakSloveneSomaliSouth AfricanSouth AmericanSouth American IndianSoviet UnionSpaniardSpanishSpanish AmericanSpanish American IndianSri LankanSubsaharan AfricanSudaneseSwedishSwissSyrianTaiwaneseThaiTlingit-HaidaTohono O'OdhamTonganTrinidadian and TobagonianTsimshianTurkishU.S. Virgin IslanderUgandanUkrainianUruguayanUteVenezuelanVietnameseWelshWest IndianYakamaYaquiYugoslavianYumanYup'ikZimbabwean
Immigration
NonimmigrantsImmigrantsAfghanistanAfricaAlbaniaArgentinaArmeniaAsiaAustraliaAustriaBahamasBangladeshBarbadosBelarusBelgiumBelizeBoliviaBosnia and HerzegovinaBrazilBulgariaBurma/MyanmarCabo VerdeCambodiaCameroonCanadaCaribbeanCentral AmericaChileChinaColombiaCongoCosta RicaCroatiaCubaCzechoslovakiaDenmarkDominicaDominican RepublicEastern AfricaEastern AsiaEastern EuropeEcuadorEgyptEl SalvadorEnglandEritreaEthiopiaEuropeFijiFranceGermanyGhanaGreeceGrenadaGuatemalaGuyanaHaitiHondurasHong KongHungaryIndiaIndonesiaIranIraqIrelandIsraelItalyJamaicaJapanJordanKazakhstanKenyaKoreaKuwaitLaosLatin AmericaLatviaLebanonLiberiaLithuaniaMalaysiaMexicoMicronesiaMiddle AfricaMoldovaMoroccoNepalNetherlandsNicaraguaNigeriaNorth AmericaNorth MacedoniaNorthern AfricaNorthern EuropeNorwayOceaniaPanamaPeruPhilippinesPolandPortugalRomaniaRussiaSaudi ArabiaScotlandSenegalSerbiaSierra LeoneSingaporeSomaliaSouth AfricaSouth AmericaSouth Central AsiaSouth Eastern AsiaSouthern EuropeSpainSri LankaSt. Vincent and the GrenadinesSudanSwedenSwitzerlandSyriaTaiwanThailandTrinidad and TobagoTurkeyUgandaUkraineUruguayUzbekistanVenezuelaVietnamWest IndiesWestern AfricaWestern AsiaWestern EuropeYemenZaireZimbabweAzores
Immigrants from Pakistan
Race
Ancestry
AfghanAfricanAlaska NativeAlaskan AthabascanAlbanianAleutAlsatianAmericanApacheArabArapahoArgentineanArmenianAssyrian/Chaldean/SyriacAustralianAustrianBahamianBangladeshiBarbadianBasqueBelgianBelizeanBermudanBhutaneseBolivianBrazilianBritishBritish West IndianBulgarianBurmeseCajunCambodianCanadianCape VerdeanCarpatho RusynCelticCentral AmericanCentral American IndianCherokeeCheyenneChickasawChileanChineseChippewaChoctawColombianColvilleComancheCosta RicanCreeCreekCroatianCrowCubanCypriotCzechCzechoslovakianDanishDelawareDominicanDutchDutch West IndianEastern EuropeanEcuadorianEgyptianEnglishEstonianEthiopianEuropeanFijianFilipinoFinnishFrenchFrench American IndianFrench CanadianGermanGerman RussianGhanaianGreekGuamanian/ChamorroGuatemalanGuyaneseHaitianHmongHonduranHopiHoumaHungarianIcelanderIndian (Asian)IndonesianInupiatIranianIraqiIrishIroquoisIsraeliItalianJamaicanJapaneseJordanianKenyanKiowaKoreanLaotianLatvianLebaneseLiberianLithuanianLumbeeLuxembourgerMacedonianMalaysianMalteseMarshalleseMenomineeMexicanMexican American IndianMongolianMoroccanNative HawaiianNavajoNepaleseNew ZealanderNicaraguanNigerianNorthern EuropeanNorwegianOkinawanOsageOttawaPaiutePakistaniPalestinianPanamanianParaguayanPennsylvania GermanPeruvianPimaPolishPortuguesePotawatomiPuebloPuerto RicanPuget Sound SalishRomanianRussianSalvadoranSamoanScandinavianScotch-IrishScottishSeminoleSenegaleseSerbianShoshoneSierra LeoneanSiouxSlavicSlovakSloveneSomaliSouth AfricanSouth AmericanSouth American IndianSoviet UnionSpaniardSpanishSpanish AmericanSpanish American IndianSri LankanSubsaharan AfricanSudaneseSwedishSwissSyrianTaiwaneseThaiTlingit-HaidaTohono O'OdhamTonganTrinidadian and TobagonianTsimshianTurkishU.S. Virgin IslanderUgandanUkrainianUruguayanUteVenezuelanVietnameseWelshWest IndianYakamaYaquiYugoslavianYumanYup'ikZimbabwean
Immigration
NonimmigrantsImmigrantsAfghanistanAfricaAlbaniaArgentinaArmeniaAsiaAustraliaAustriaBahamasBangladeshBarbadosBelarusBelgiumBelizeBoliviaBosnia and HerzegovinaBrazilBulgariaBurma/MyanmarCabo VerdeCambodiaCameroonCanadaCaribbeanCentral AmericaChileChinaColombiaCongoCosta RicaCroatiaCubaCzechoslovakiaDenmarkDominicaDominican RepublicEastern AfricaEastern AsiaEastern EuropeEcuadorEgyptEl SalvadorEnglandEritreaEthiopiaEuropeFijiFranceGermanyGhanaGreeceGrenadaGuatemalaGuyanaHaitiHondurasHong KongHungaryIndiaIndonesiaIranIraqIrelandIsraelItalyJamaicaJapanJordanKazakhstanKenyaKoreaKuwaitLaosLatin AmericaLatviaLebanonLiberiaLithuaniaMalaysiaMexicoMicronesiaMiddle AfricaMoldovaMoroccoNepalNetherlandsNicaraguaNigeriaNorth AmericaNorth MacedoniaNorthern AfricaNorthern EuropeNorwayOceaniaPakistanPanamaPeruPhilippinesPolandPortugalRomaniaRussiaSaudi ArabiaScotlandSenegalSerbiaSierra LeoneSingaporeSomaliaSouth AfricaSouth AmericaSouth Central AsiaSouth Eastern AsiaSouthern EuropeSpainSri LankaSt. Vincent and the GrenadinesSudanSwedenSwitzerlandSyriaTaiwanThailandTrinidad and TobagoTurkeyUgandaUkraineUruguayUzbekistanVenezuelaVietnamWest IndiesWestern AfricaWestern AsiaWestern EuropeYemenZaireZimbabweAzores
Female Poverty
Income
Poverty
Unemployment
Labor Participation
Family Structure
Vehicle Availability
Education Level
Disability

Female Poverty Comparison

Blackfeet

Immigrants from Pakistan

Tragic
Exceptional
16.4%
FEMALE POVERTY
0.0/ 100
METRIC RATING
289th/ 347
METRIC RANK
11.8%
FEMALE POVERTY
99.4/ 100
METRIC RATING
36th/ 347
METRIC RANK

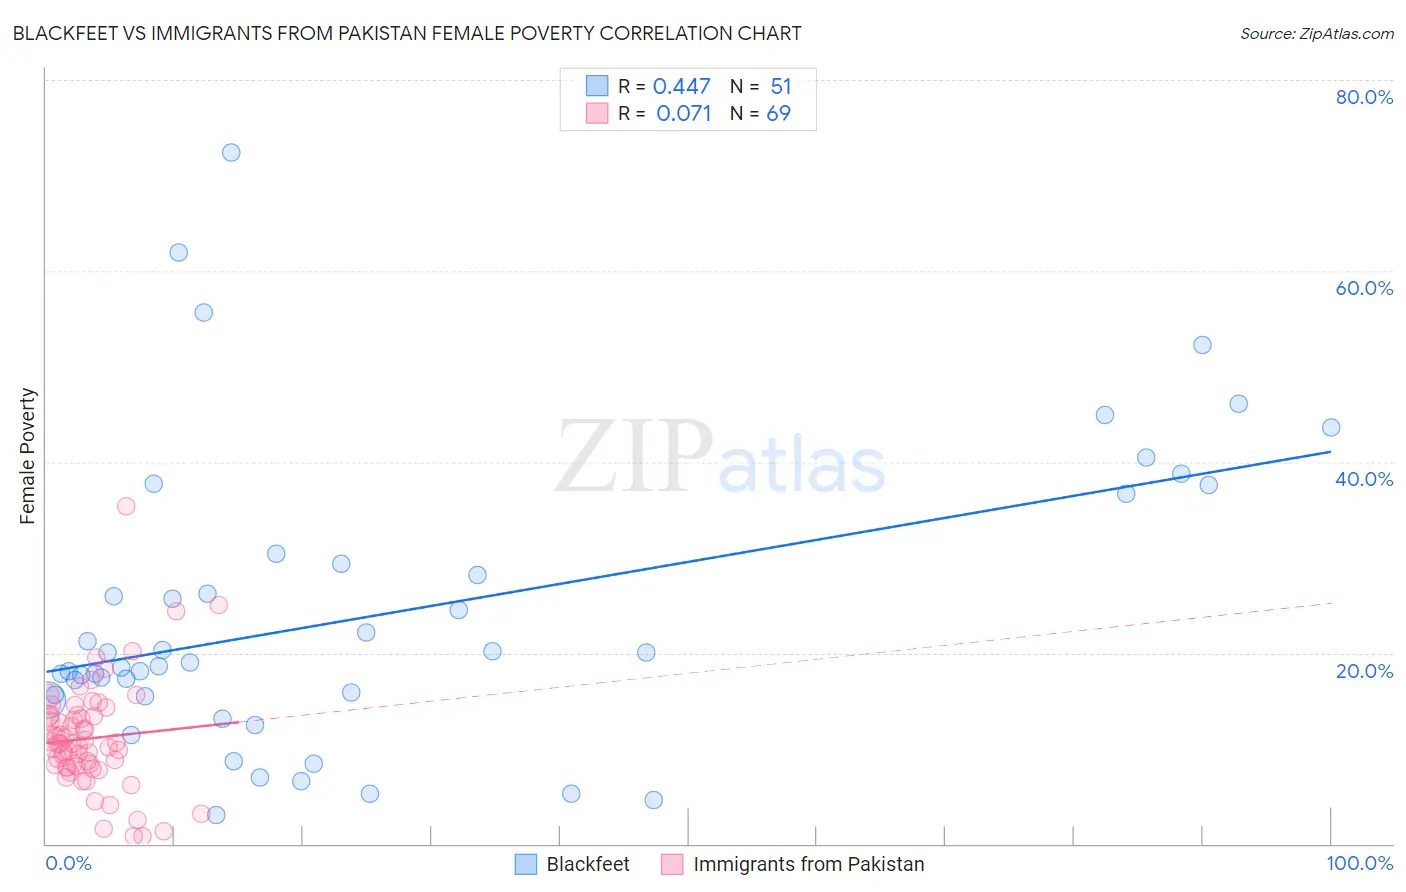
Blackfeet vs Immigrants from Pakistan Female Poverty Correlation Chart

The statistical analysis conducted on geographies consisting of 309,450,114 people shows a moderate positive correlation between the proportion of Blackfeet and poverty level among females in the United States with a correlation coefficient (R) of 0.447 and weighted average of 16.4%. Similarly, the statistical analysis conducted on geographies consisting of 283,777,836 people shows a slight positive correlation between the proportion of Immigrants from Pakistan and poverty level among females in the United States with a correlation coefficient (R) of 0.071 and weighted average of 11.8%, a difference of 38.6%.
Blackfeet vs Immigrants from Pakistan Female Poverty

Female Poverty Correlation Summary

MeasurementBlackfeetImmigrants from Pakistan
Minimum3.0%0.75%
Maximum72.4%35.3%
Range69.4%34.6%
Mean24.1%11.0%
Median19.0%10.5%
Interquartile 25% (IQ1)15.5%8.1%
Interquartile 75% (IQ3)30.4%13.4%
Interquartile Range (IQR)14.9%5.3%
Standard Deviation (Sample)15.4%5.7%
Standard Deviation (Population)15.2%5.6%

Similar Demographics by Female Poverty

Demographics Similar to Blackfeet by Female Poverty

In terms of female poverty, the demographic groups most similar to Blackfeet are Indonesian (16.4%, a difference of 0.010%), Immigrants from Bangladesh (16.4%, a difference of 0.19%), Yaqui (16.4%, a difference of 0.36%), Immigrants from Zaire (16.4%, a difference of 0.37%), and Immigrants from Latin America (16.4%, a difference of 0.42%).
DemographicsRating | RankFemale Poverty
Immigrants | Haiti
0.0
/100
|
#282
Tragic
16.1%
Immigrants | Cuba
0.0
/100
|
#283
Tragic
16.1%
Spanish Americans
0.0
/100
|
#284
Tragic
16.2%
Comanche
0.0
/100
|
#285
Tragic
16.2%
Inupiat
0.0
/100
|
#286
Tragic
16.2%
Immigrants | Belize
0.0
/100
|
#287
Tragic
16.3%
Indonesians
0.0
/100
|
#288
Tragic
16.4%
Blackfeet
0.0
/100
|
#289
Tragic
16.4%
Immigrants | Bangladesh
0.0
/100
|
#290
Tragic
16.4%
Yaqui
0.0
/100
|
#291
Tragic
16.4%
Immigrants | Zaire
0.0
/100
|
#292
Tragic
16.4%
Immigrants | Latin America
0.0
/100
|
#293
Tragic
16.4%
Immigrants | Cabo Verde
0.0
/100
|
#294
Tragic
16.4%
Senegalese
0.0
/100
|
#295
Tragic
16.5%
Immigrants | Senegal
0.0
/100
|
#296
Tragic
16.5%

Demographics Similar to Immigrants from Pakistan by Female Poverty

In terms of female poverty, the demographic groups most similar to Immigrants from Pakistan are Immigrants from Greece (11.8%, a difference of 0.10%), Russian (11.8%, a difference of 0.11%), Immigrants from Iran (11.8%, a difference of 0.17%), Immigrants from Poland (11.8%, a difference of 0.32%), and Immigrants from Singapore (11.8%, a difference of 0.34%).
DemographicsRating | RankFemale Poverty
Immigrants | North Macedonia
99.6
/100
|
#29
Exceptional
11.7%
Greeks
99.5
/100
|
#30
Exceptional
11.7%
Poles
99.5
/100
|
#31
Exceptional
11.7%
Danes
99.5
/100
|
#32
Exceptional
11.7%
Cypriots
99.5
/100
|
#33
Exceptional
11.8%
Immigrants | Singapore
99.4
/100
|
#34
Exceptional
11.8%
Immigrants | Iran
99.4
/100
|
#35
Exceptional
11.8%
Immigrants | Pakistan
99.4
/100
|
#36
Exceptional
11.8%
Immigrants | Greece
99.3
/100
|
#37
Exceptional
11.8%
Russians
99.3
/100
|
#38
Exceptional
11.8%
Immigrants | Poland
99.3
/100
|
#39
Exceptional
11.8%
Macedonians
99.3
/100
|
#40
Exceptional
11.8%
Czechs
99.2
/100
|
#41
Exceptional
11.9%
Immigrants | Moldova
99.2
/100
|
#42
Exceptional
11.9%
Koreans
99.2
/100
|
#43
Exceptional
11.9%