Blackfeet vs German Russian Female Poverty
COMPARE
Blackfeet
German Russian
Female Poverty
Female Poverty Comparison
Blackfeet
German Russians
16.4%
FEMALE POVERTY
0.0/ 100
METRIC RATING
289th/ 347
METRIC RANK
14.7%
FEMALE POVERTY
2.0/ 100
METRIC RATING
228th/ 347
METRIC RANK
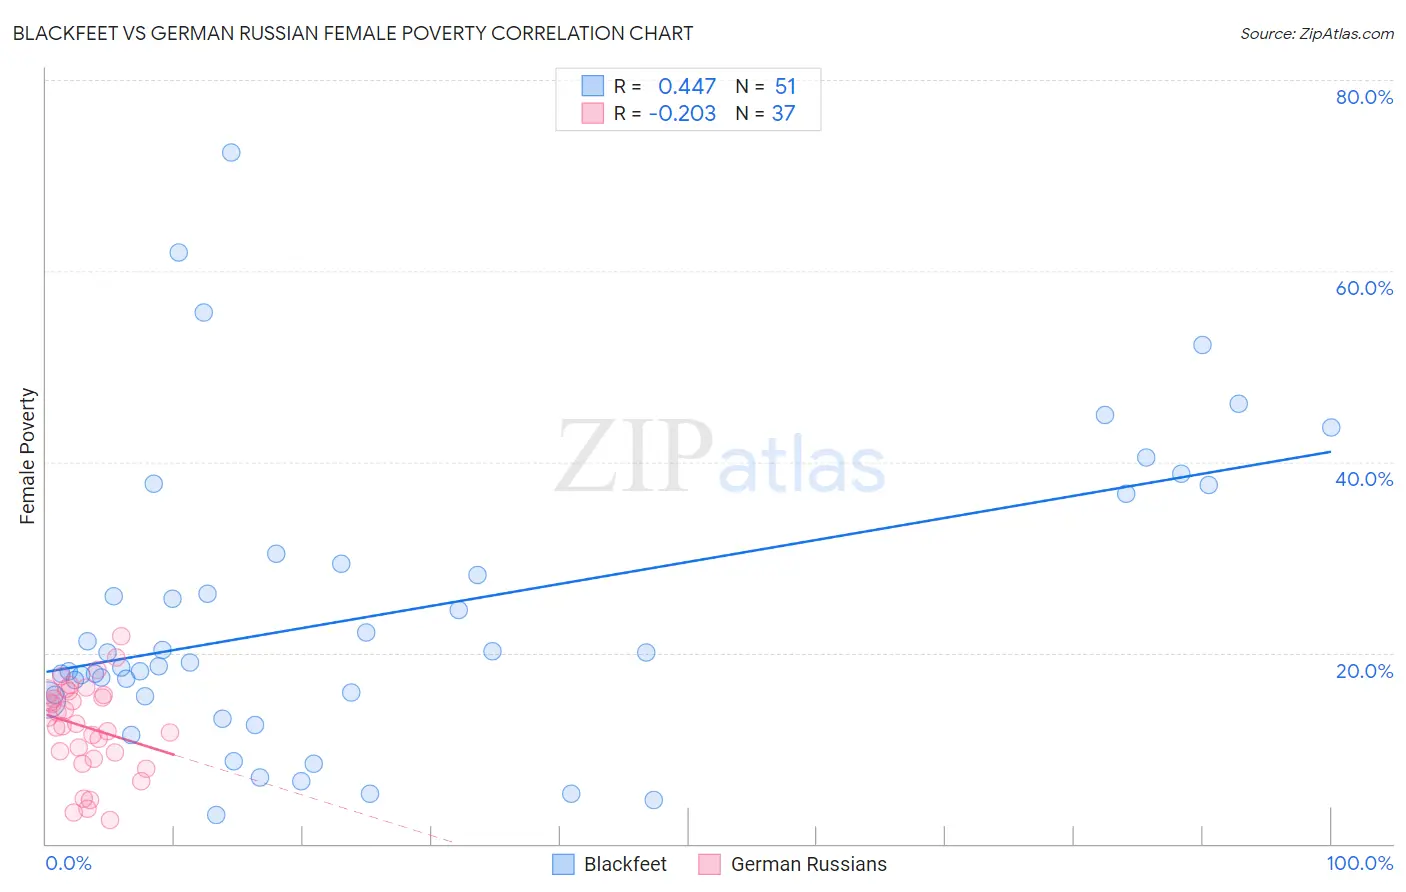
Blackfeet vs German Russian Female Poverty Correlation Chart
The statistical analysis conducted on geographies consisting of 309,450,114 people shows a moderate positive correlation between the proportion of Blackfeet and poverty level among females in the United States with a correlation coefficient (R) of 0.447 and weighted average of 16.4%. Similarly, the statistical analysis conducted on geographies consisting of 96,439,432 people shows a weak negative correlation between the proportion of German Russians and poverty level among females in the United States with a correlation coefficient (R) of -0.203 and weighted average of 14.7%, a difference of 11.3%.
Female Poverty Correlation Summary
| Measurement | Blackfeet | German Russian |
| Minimum | 3.0% | 2.5% |
| Maximum | 72.4% | 21.7% |
| Range | 69.4% | 19.2% |
| Mean | 24.1% | 12.2% |
| Median | 19.0% | 12.6% |
| Interquartile 25% (IQ1) | 15.5% | 9.2% |
| Interquartile 75% (IQ3) | 30.4% | 15.8% |
| Interquartile Range (IQR) | 14.9% | 6.6% |
| Standard Deviation (Sample) | 15.4% | 4.7% |
| Standard Deviation (Population) | 15.2% | 4.7% |
Similar Demographics by Female Poverty
Demographics Similar to Blackfeet by Female Poverty
In terms of female poverty, the demographic groups most similar to Blackfeet are Indonesian (16.4%, a difference of 0.010%), Immigrants from Bangladesh (16.4%, a difference of 0.19%), Yaqui (16.4%, a difference of 0.36%), Immigrants from Zaire (16.4%, a difference of 0.37%), and Immigrants from Latin America (16.4%, a difference of 0.42%).
| Demographics | Rating | Rank | Female Poverty |
| Immigrants | Haiti | 0.0 /100 | #282 | Tragic 16.1% |
| Immigrants | Cuba | 0.0 /100 | #283 | Tragic 16.1% |
| Spanish Americans | 0.0 /100 | #284 | Tragic 16.2% |
| Comanche | 0.0 /100 | #285 | Tragic 16.2% |
| Inupiat | 0.0 /100 | #286 | Tragic 16.2% |
| Immigrants | Belize | 0.0 /100 | #287 | Tragic 16.3% |
| Indonesians | 0.0 /100 | #288 | Tragic 16.4% |
| Blackfeet | 0.0 /100 | #289 | Tragic 16.4% |
| Immigrants | Bangladesh | 0.0 /100 | #290 | Tragic 16.4% |
| Yaqui | 0.0 /100 | #291 | Tragic 16.4% |
| Immigrants | Zaire | 0.0 /100 | #292 | Tragic 16.4% |
| Immigrants | Latin America | 0.0 /100 | #293 | Tragic 16.4% |
| Immigrants | Cabo Verde | 0.0 /100 | #294 | Tragic 16.4% |
| Senegalese | 0.0 /100 | #295 | Tragic 16.5% |
| Immigrants | Senegal | 0.0 /100 | #296 | Tragic 16.5% |
Demographics Similar to German Russians by Female Poverty
In terms of female poverty, the demographic groups most similar to German Russians are Ghanaian (14.7%, a difference of 0.060%), Immigrants from Nigeria (14.7%, a difference of 0.15%), Alaska Native (14.7%, a difference of 0.27%), Nigerian (14.8%, a difference of 0.36%), and Immigrants from Eritrea (14.6%, a difference of 0.45%).
| Demographics | Rating | Rank | Female Poverty |
| Immigrants | Cambodia | 3.7 /100 | #221 | Tragic 14.5% |
| Immigrants | Nonimmigrants | 3.7 /100 | #222 | Tragic 14.5% |
| Immigrants | Africa | 3.3 /100 | #223 | Tragic 14.5% |
| Americans | 2.8 /100 | #224 | Tragic 14.6% |
| Immigrants | Micronesia | 2.8 /100 | #225 | Tragic 14.6% |
| Immigrants | Eritrea | 2.4 /100 | #226 | Tragic 14.6% |
| Immigrants | Nigeria | 2.1 /100 | #227 | Tragic 14.7% |
| German Russians | 2.0 /100 | #228 | Tragic 14.7% |
| Ghanaians | 1.9 /100 | #229 | Tragic 14.7% |
| Alaska Natives | 1.8 /100 | #230 | Tragic 14.7% |
| Nigerians | 1.7 /100 | #231 | Tragic 14.8% |
| Osage | 1.5 /100 | #232 | Tragic 14.8% |
| Immigrants | Saudi Arabia | 1.4 /100 | #233 | Tragic 14.8% |
| Fijians | 1.1 /100 | #234 | Tragic 14.9% |
| Immigrants | Laos | 0.9 /100 | #235 | Tragic 15.0% |