Bermudan vs Czechoslovakian Family Poverty
COMPARE
Bermudan
Czechoslovakian
Family Poverty
Family Poverty Comparison
Bermudans
Czechoslovakians
9.9%
FAMILY POVERTY
5.3/ 100
METRIC RATING
220th/ 347
METRIC RANK
8.0%
FAMILY POVERTY
96.8/ 100
METRIC RATING
92nd/ 347
METRIC RANK
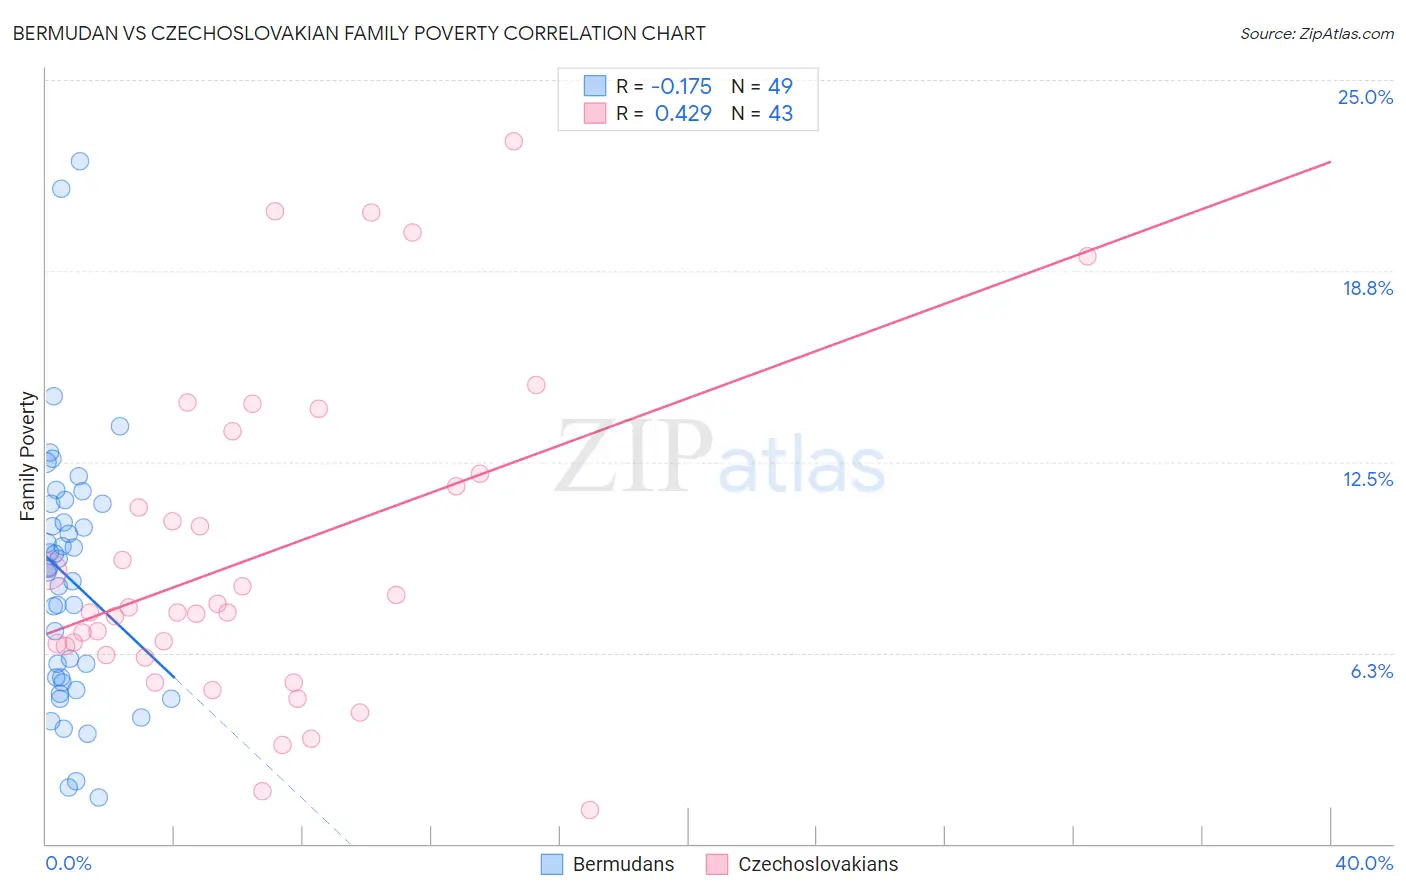
Bermudan vs Czechoslovakian Family Poverty Correlation Chart
The statistical analysis conducted on geographies consisting of 55,709,742 people shows a poor negative correlation between the proportion of Bermudans and poverty level among families in the United States with a correlation coefficient (R) of -0.175 and weighted average of 9.9%. Similarly, the statistical analysis conducted on geographies consisting of 367,669,162 people shows a moderate positive correlation between the proportion of Czechoslovakians and poverty level among families in the United States with a correlation coefficient (R) of 0.429 and weighted average of 8.0%, a difference of 23.2%.
Family Poverty Correlation Summary
| Measurement | Bermudan | Czechoslovakian |
| Minimum | 1.5% | 1.1% |
| Maximum | 22.4% | 23.0% |
| Range | 20.8% | 21.9% |
| Mean | 8.7% | 9.4% |
| Median | 9.0% | 7.6% |
| Interquartile 25% (IQ1) | 5.3% | 6.2% |
| Interquartile 75% (IQ3) | 11.1% | 12.1% |
| Interquartile Range (IQR) | 5.8% | 5.9% |
| Standard Deviation (Sample) | 4.3% | 5.3% |
| Standard Deviation (Population) | 4.2% | 5.2% |
Similar Demographics by Family Poverty
Demographics Similar to Bermudans by Family Poverty
In terms of family poverty, the demographic groups most similar to Bermudans are Immigrants from Eritrea (9.9%, a difference of 0.060%), Panamanian (9.8%, a difference of 0.18%), Immigrants from Cambodia (9.9%, a difference of 0.27%), Japanese (9.9%, a difference of 0.31%), and American (9.8%, a difference of 0.50%).
| Demographics | Rating | Rank | Family Poverty |
| Osage | 8.0 /100 | #213 | Tragic 9.7% |
| Immigrants | Micronesia | 6.7 /100 | #214 | Tragic 9.8% |
| Immigrants | Nonimmigrants | 6.7 /100 | #215 | Tragic 9.8% |
| Moroccans | 6.5 /100 | #216 | Tragic 9.8% |
| Americans | 6.2 /100 | #217 | Tragic 9.8% |
| Panamanians | 5.6 /100 | #218 | Tragic 9.8% |
| Immigrants | Eritrea | 5.4 /100 | #219 | Tragic 9.9% |
| Bermudans | 5.3 /100 | #220 | Tragic 9.9% |
| Immigrants | Cambodia | 4.8 /100 | #221 | Tragic 9.9% |
| Japanese | 4.8 /100 | #222 | Tragic 9.9% |
| Immigrants | Africa | 4.3 /100 | #223 | Tragic 9.9% |
| Marshallese | 3.9 /100 | #224 | Tragic 9.9% |
| Immigrants | Immigrants | 3.6 /100 | #225 | Tragic 10.0% |
| Ottawa | 3.3 /100 | #226 | Tragic 10.0% |
| Immigrants | Armenia | 3.3 /100 | #227 | Tragic 10.0% |
Demographics Similar to Czechoslovakians by Family Poverty
In terms of family poverty, the demographic groups most similar to Czechoslovakians are Tlingit-Haida (8.0%, a difference of 0.18%), Immigrants from Italy (8.0%, a difference of 0.24%), Immigrants from Pakistan (8.0%, a difference of 0.29%), Immigrants from Philippines (8.0%, a difference of 0.30%), and Immigrants from Turkey (8.0%, a difference of 0.32%).
| Demographics | Rating | Rank | Family Poverty |
| Immigrants | Asia | 97.4 /100 | #85 | Exceptional 7.9% |
| Scottish | 97.3 /100 | #86 | Exceptional 7.9% |
| Belgians | 97.3 /100 | #87 | Exceptional 8.0% |
| Serbians | 97.2 /100 | #88 | Exceptional 8.0% |
| Immigrants | Denmark | 97.1 /100 | #89 | Exceptional 8.0% |
| Immigrants | England | 97.1 /100 | #90 | Exceptional 8.0% |
| Immigrants | Italy | 97.0 /100 | #91 | Exceptional 8.0% |
| Czechoslovakians | 96.8 /100 | #92 | Exceptional 8.0% |
| Tlingit-Haida | 96.7 /100 | #93 | Exceptional 8.0% |
| Immigrants | Pakistan | 96.6 /100 | #94 | Exceptional 8.0% |
| Immigrants | Philippines | 96.5 /100 | #95 | Exceptional 8.0% |
| Immigrants | Turkey | 96.5 /100 | #96 | Exceptional 8.0% |
| Immigrants | Switzerland | 96.1 /100 | #97 | Exceptional 8.1% |
| Immigrants | South Africa | 95.9 /100 | #98 | Exceptional 8.1% |
| Welsh | 95.8 /100 | #99 | Exceptional 8.1% |