Bermudan vs Czechoslovakian Child Poverty Among Boys Under 16
COMPARE
Bermudan
Czechoslovakian
Child Poverty Among Boys Under 16
Child Poverty Among Boys Under 16 Comparison
Bermudans
Czechoslovakians
18.1%
CHILD POVERTY AMONG BOYS UNDER 16
2.5/ 100
METRIC RATING
227th/ 347
METRIC RANK
15.3%
CHILD POVERTY AMONG BOYS UNDER 16
92.1/ 100
METRIC RATING
125th/ 347
METRIC RANK
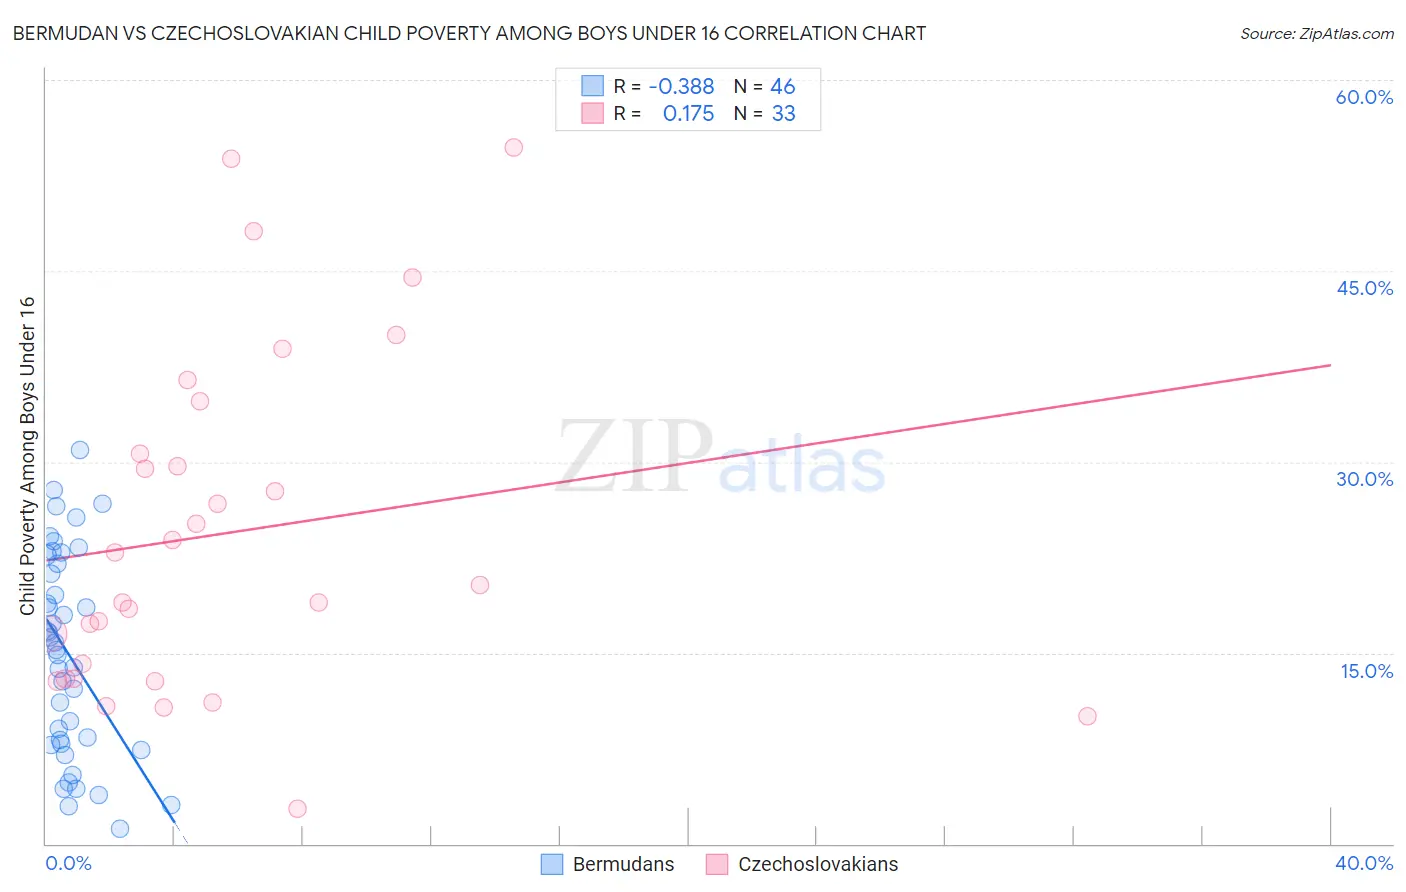
Bermudan vs Czechoslovakian Child Poverty Among Boys Under 16 Correlation Chart
The statistical analysis conducted on geographies consisting of 55,633,001 people shows a mild negative correlation between the proportion of Bermudans and poverty level among boys under the age of 16 in the United States with a correlation coefficient (R) of -0.388 and weighted average of 18.1%. Similarly, the statistical analysis conducted on geographies consisting of 361,979,827 people shows a poor positive correlation between the proportion of Czechoslovakians and poverty level among boys under the age of 16 in the United States with a correlation coefficient (R) of 0.175 and weighted average of 15.3%, a difference of 18.4%.
Child Poverty Among Boys Under 16 Correlation Summary
| Measurement | Bermudan | Czechoslovakian |
| Minimum | 1.2% | 2.7% |
| Maximum | 31.0% | 54.7% |
| Range | 29.7% | 51.9% |
| Mean | 14.9% | 24.4% |
| Median | 15.5% | 20.3% |
| Interquartile 25% (IQ1) | 7.8% | 13.0% |
| Interquartile 75% (IQ3) | 22.0% | 32.7% |
| Interquartile Range (IQR) | 14.2% | 19.7% |
| Standard Deviation (Sample) | 7.9% | 13.3% |
| Standard Deviation (Population) | 7.8% | 13.1% |
Similar Demographics by Child Poverty Among Boys Under 16
Demographics Similar to Bermudans by Child Poverty Among Boys Under 16
In terms of child poverty among boys under 16, the demographic groups most similar to Bermudans are Immigrants from Africa (18.1%, a difference of 0.10%), Inupiat (18.1%, a difference of 0.26%), Nonimmigrants (18.2%, a difference of 0.33%), Nepalese (18.0%, a difference of 0.67%), and Immigrants from Micronesia (18.3%, a difference of 0.85%).
| Demographics | Rating | Rank | Child Poverty Among Boys Under 16 |
| Immigrants | Cambodia | 5.1 /100 | #220 | Tragic 17.8% |
| Immigrants | Panama | 4.3 /100 | #221 | Tragic 17.9% |
| Pennsylvania Germans | 3.9 /100 | #222 | Tragic 17.9% |
| Cubans | 3.8 /100 | #223 | Tragic 17.9% |
| Nepalese | 3.2 /100 | #224 | Tragic 18.0% |
| Inupiat | 2.7 /100 | #225 | Tragic 18.1% |
| Immigrants | Africa | 2.6 /100 | #226 | Tragic 18.1% |
| Bermudans | 2.5 /100 | #227 | Tragic 18.1% |
| Immigrants | Nonimmigrants | 2.2 /100 | #228 | Tragic 18.2% |
| Immigrants | Micronesia | 1.8 /100 | #229 | Tragic 18.3% |
| Fijians | 1.8 /100 | #230 | Tragic 18.3% |
| Nicaraguans | 1.4 /100 | #231 | Tragic 18.4% |
| Marshallese | 1.3 /100 | #232 | Tragic 18.4% |
| Immigrants | Nigeria | 1.2 /100 | #233 | Tragic 18.4% |
| Nigerians | 1.1 /100 | #234 | Tragic 18.5% |
Demographics Similar to Czechoslovakians by Child Poverty Among Boys Under 16
In terms of child poverty among boys under 16, the demographic groups most similar to Czechoslovakians are Tlingit-Haida (15.3%, a difference of 0.070%), Immigrants from Norway (15.3%, a difference of 0.080%), Immigrants from Malaysia (15.3%, a difference of 0.30%), Palestinian (15.4%, a difference of 0.31%), and Carpatho Rusyn (15.4%, a difference of 0.36%).
| Demographics | Rating | Rank | Child Poverty Among Boys Under 16 |
| Native Hawaiians | 93.4 /100 | #118 | Exceptional 15.2% |
| Belgians | 93.1 /100 | #119 | Exceptional 15.2% |
| South Africans | 93.0 /100 | #120 | Exceptional 15.2% |
| Scottish | 93.0 /100 | #121 | Exceptional 15.2% |
| Immigrants | Malaysia | 92.8 /100 | #122 | Exceptional 15.3% |
| Immigrants | Norway | 92.3 /100 | #123 | Exceptional 15.3% |
| Tlingit-Haida | 92.2 /100 | #124 | Exceptional 15.3% |
| Czechoslovakians | 92.1 /100 | #125 | Exceptional 15.3% |
| Palestinians | 91.3 /100 | #126 | Exceptional 15.4% |
| Carpatho Rusyns | 91.1 /100 | #127 | Exceptional 15.4% |
| Canadians | 90.6 /100 | #128 | Exceptional 15.4% |
| Immigrants | Brazil | 90.3 /100 | #129 | Exceptional 15.4% |
| Mongolians | 90.2 /100 | #130 | Exceptional 15.4% |
| Immigrants | Western Europe | 90.0 /100 | #131 | Exceptional 15.4% |
| Immigrants | Kazakhstan | 88.7 /100 | #132 | Excellent 15.5% |