Bermudan vs Arapaho Family Poverty
COMPARE
Bermudan
Arapaho
Family Poverty
Family Poverty Comparison
Bermudans
Arapaho
9.9%
FAMILY POVERTY
5.3/ 100
METRIC RATING
220th/ 347
METRIC RANK
12.7%
FAMILY POVERTY
0.0/ 100
METRIC RATING
321st/ 347
METRIC RANK
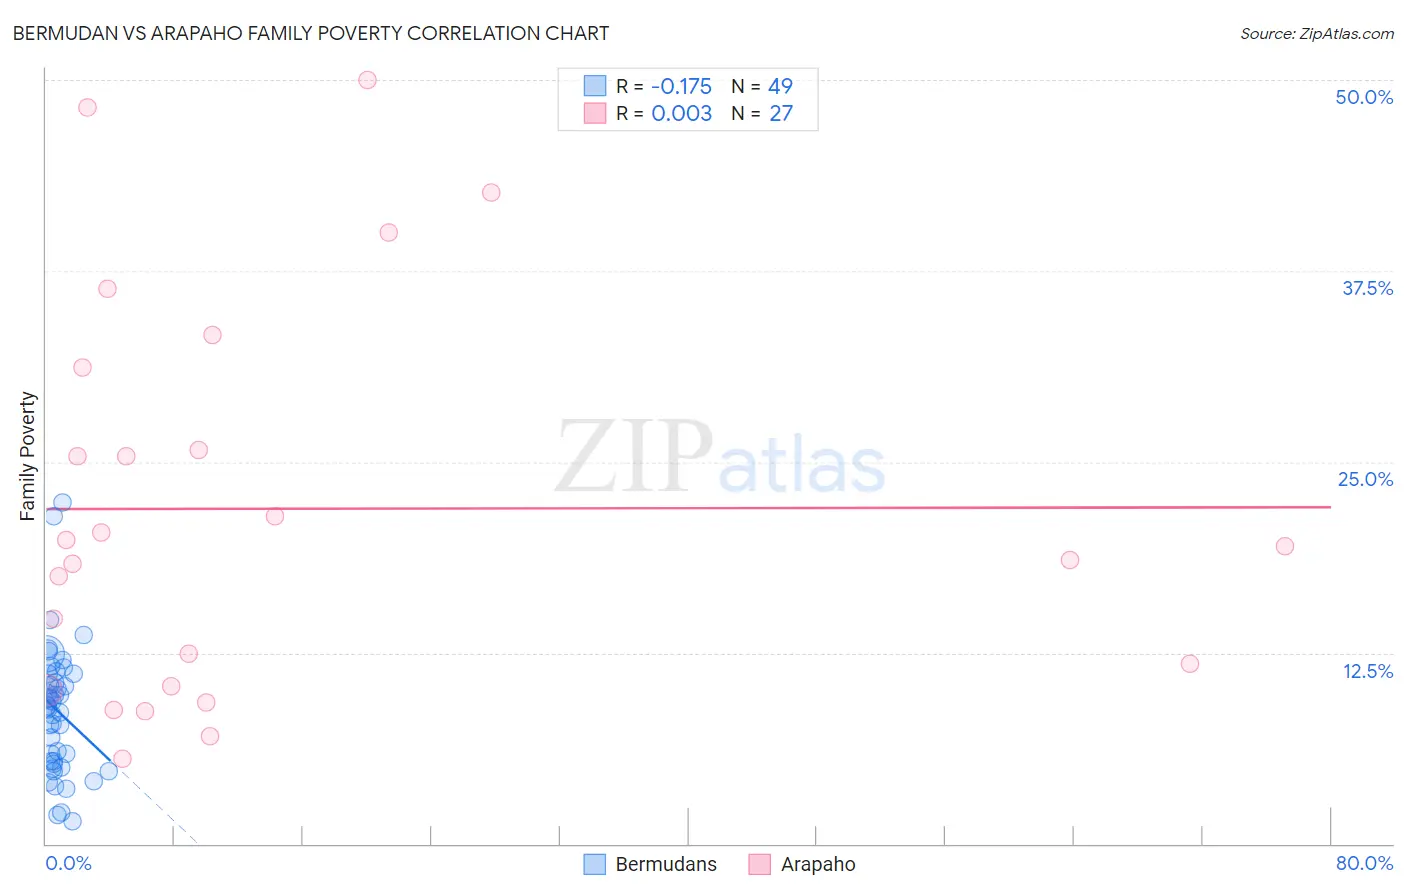
Bermudan vs Arapaho Family Poverty Correlation Chart
The statistical analysis conducted on geographies consisting of 55,709,742 people shows a poor negative correlation between the proportion of Bermudans and poverty level among families in the United States with a correlation coefficient (R) of -0.175 and weighted average of 9.9%. Similarly, the statistical analysis conducted on geographies consisting of 29,764,504 people shows no correlation between the proportion of Arapaho and poverty level among families in the United States with a correlation coefficient (R) of 0.003 and weighted average of 12.7%, a difference of 28.3%.
Family Poverty Correlation Summary
| Measurement | Bermudan | Arapaho |
| Minimum | 1.5% | 5.6% |
| Maximum | 22.4% | 50.0% |
| Range | 20.8% | 44.4% |
| Mean | 8.7% | 21.9% |
| Median | 9.0% | 19.5% |
| Interquartile 25% (IQ1) | 5.3% | 10.3% |
| Interquartile 75% (IQ3) | 11.1% | 31.2% |
| Interquartile Range (IQR) | 5.8% | 20.8% |
| Standard Deviation (Sample) | 4.3% | 12.8% |
| Standard Deviation (Population) | 4.2% | 12.6% |
Similar Demographics by Family Poverty
Demographics Similar to Bermudans by Family Poverty
In terms of family poverty, the demographic groups most similar to Bermudans are Immigrants from Eritrea (9.9%, a difference of 0.060%), Panamanian (9.8%, a difference of 0.18%), Immigrants from Cambodia (9.9%, a difference of 0.27%), Japanese (9.9%, a difference of 0.31%), and American (9.8%, a difference of 0.50%).
| Demographics | Rating | Rank | Family Poverty |
| Osage | 8.0 /100 | #213 | Tragic 9.7% |
| Immigrants | Micronesia | 6.7 /100 | #214 | Tragic 9.8% |
| Immigrants | Nonimmigrants | 6.7 /100 | #215 | Tragic 9.8% |
| Moroccans | 6.5 /100 | #216 | Tragic 9.8% |
| Americans | 6.2 /100 | #217 | Tragic 9.8% |
| Panamanians | 5.6 /100 | #218 | Tragic 9.8% |
| Immigrants | Eritrea | 5.4 /100 | #219 | Tragic 9.9% |
| Bermudans | 5.3 /100 | #220 | Tragic 9.9% |
| Immigrants | Cambodia | 4.8 /100 | #221 | Tragic 9.9% |
| Japanese | 4.8 /100 | #222 | Tragic 9.9% |
| Immigrants | Africa | 4.3 /100 | #223 | Tragic 9.9% |
| Marshallese | 3.9 /100 | #224 | Tragic 9.9% |
| Immigrants | Immigrants | 3.6 /100 | #225 | Tragic 10.0% |
| Ottawa | 3.3 /100 | #226 | Tragic 10.0% |
| Immigrants | Armenia | 3.3 /100 | #227 | Tragic 10.0% |
Demographics Similar to Arapaho by Family Poverty
In terms of family poverty, the demographic groups most similar to Arapaho are Immigrants from Honduras (12.7%, a difference of 0.10%), Menominee (12.7%, a difference of 0.65%), Immigrants from Dominica (12.7%, a difference of 0.72%), Inupiat (12.5%, a difference of 1.5%), and British West Indian (12.4%, a difference of 2.0%).
| Demographics | Rating | Rank | Family Poverty |
| Kiowa | 0.0 /100 | #314 | Tragic 12.2% |
| Immigrants | Mexico | 0.0 /100 | #315 | Tragic 12.3% |
| Hondurans | 0.0 /100 | #316 | Tragic 12.4% |
| Immigrants | Grenada | 0.0 /100 | #317 | Tragic 12.4% |
| U.S. Virgin Islanders | 0.0 /100 | #318 | Tragic 12.4% |
| British West Indians | 0.0 /100 | #319 | Tragic 12.4% |
| Inupiat | 0.0 /100 | #320 | Tragic 12.5% |
| Arapaho | 0.0 /100 | #321 | Tragic 12.7% |
| Immigrants | Honduras | 0.0 /100 | #322 | Tragic 12.7% |
| Menominee | 0.0 /100 | #323 | Tragic 12.7% |
| Immigrants | Dominica | 0.0 /100 | #324 | Tragic 12.7% |
| Paiute | 0.0 /100 | #325 | Tragic 13.0% |
| Colville | 0.0 /100 | #326 | Tragic 13.0% |
| Yakama | 0.0 /100 | #327 | Tragic 13.1% |
| Central American Indians | 0.0 /100 | #328 | Tragic 13.3% |