Basque vs Immigrants from Sierra Leone Male Poverty
COMPARE
Basque
Immigrants from Sierra Leone
Male Poverty
Male Poverty Comparison
Basques
Immigrants from Sierra Leone
10.9%
MALE POVERTY
74.6/ 100
METRIC RATING
142nd/ 347
METRIC RANK
11.4%
MALE POVERTY
32.9/ 100
METRIC RATING
186th/ 347
METRIC RANK
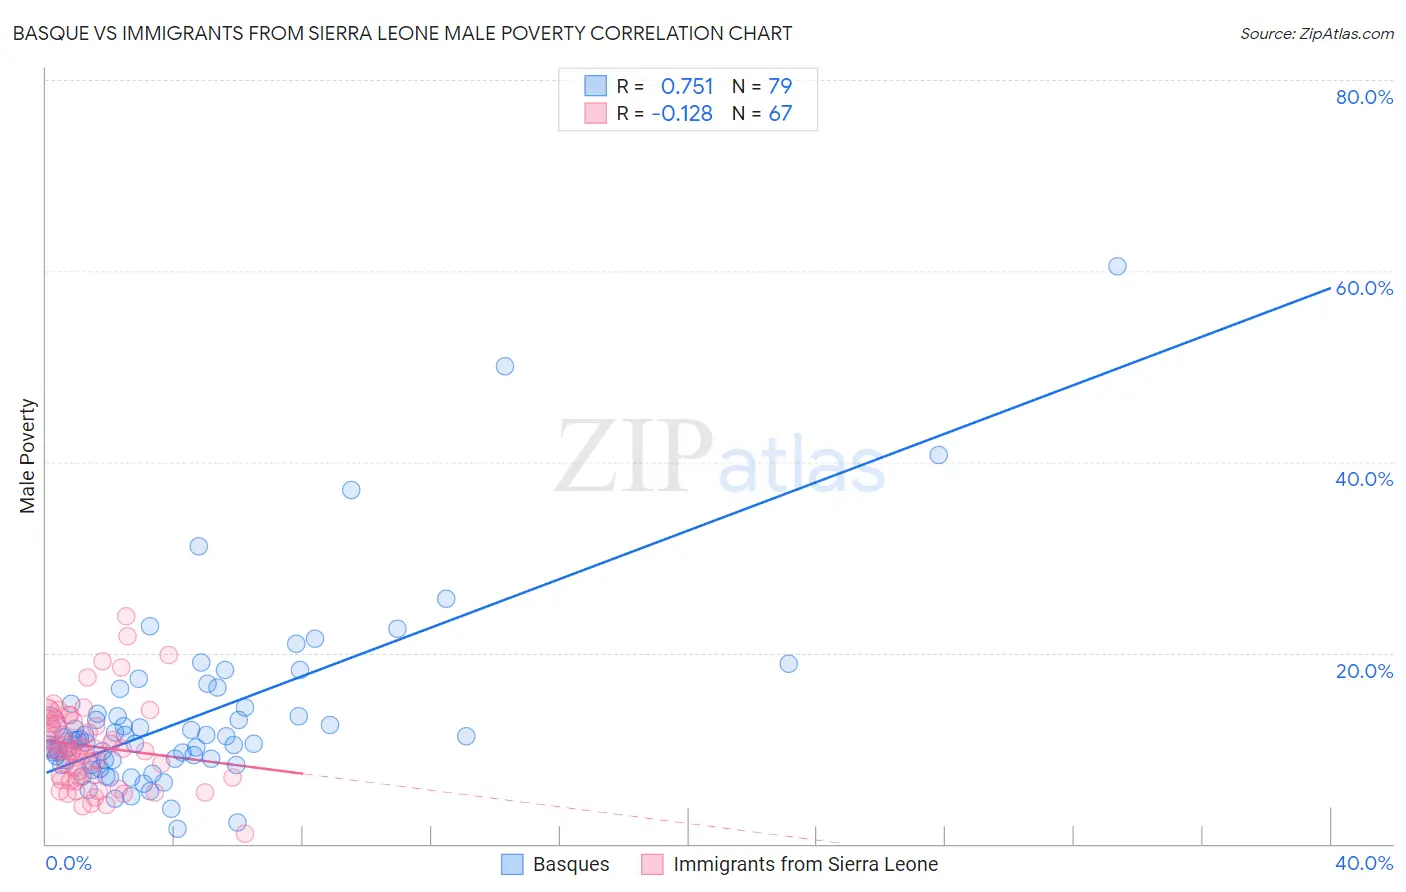
Basque vs Immigrants from Sierra Leone Male Poverty Correlation Chart
The statistical analysis conducted on geographies consisting of 165,709,169 people shows a strong positive correlation between the proportion of Basques and poverty level among males in the United States with a correlation coefficient (R) of 0.751 and weighted average of 10.9%. Similarly, the statistical analysis conducted on geographies consisting of 101,636,986 people shows a poor negative correlation between the proportion of Immigrants from Sierra Leone and poverty level among males in the United States with a correlation coefficient (R) of -0.128 and weighted average of 11.4%, a difference of 4.5%.
Male Poverty Correlation Summary
| Measurement | Basque | Immigrants from Sierra Leone |
| Minimum | 1.5% | 1.0% |
| Maximum | 60.5% | 23.8% |
| Range | 59.0% | 22.8% |
| Mean | 13.3% | 10.2% |
| Median | 10.9% | 9.9% |
| Interquartile 25% (IQ1) | 8.7% | 6.9% |
| Interquartile 75% (IQ3) | 14.3% | 12.8% |
| Interquartile Range (IQR) | 5.6% | 5.9% |
| Standard Deviation (Sample) | 9.6% | 4.4% |
| Standard Deviation (Population) | 9.5% | 4.4% |
Similar Demographics by Male Poverty
Demographics Similar to Basques by Male Poverty
In terms of male poverty, the demographic groups most similar to Basques are Immigrants from France (10.9%, a difference of 0.17%), Tlingit-Haida (10.9%, a difference of 0.20%), Afghan (10.9%, a difference of 0.34%), Samoan (10.9%, a difference of 0.36%), and Immigrants from Germany (10.9%, a difference of 0.38%).
| Demographics | Rating | Rank | Male Poverty |
| Brazilians | 82.7 /100 | #135 | Excellent 10.8% |
| Immigrants | Israel | 80.9 /100 | #136 | Excellent 10.8% |
| Immigrants | Switzerland | 79.2 /100 | #137 | Good 10.8% |
| Yugoslavians | 78.2 /100 | #138 | Good 10.8% |
| Immigrants | Jordan | 77.5 /100 | #139 | Good 10.8% |
| Tlingit-Haida | 76.1 /100 | #140 | Good 10.9% |
| Immigrants | France | 75.8 /100 | #141 | Good 10.9% |
| Basques | 74.6 /100 | #142 | Good 10.9% |
| Afghans | 71.9 /100 | #143 | Good 10.9% |
| Samoans | 71.8 /100 | #144 | Good 10.9% |
| Immigrants | Germany | 71.6 /100 | #145 | Good 10.9% |
| Syrians | 71.4 /100 | #146 | Good 10.9% |
| Icelanders | 68.5 /100 | #147 | Good 11.0% |
| Armenians | 68.0 /100 | #148 | Good 11.0% |
| Immigrants | Venezuela | 67.9 /100 | #149 | Good 11.0% |
Demographics Similar to Immigrants from Sierra Leone by Male Poverty
In terms of male poverty, the demographic groups most similar to Immigrants from Sierra Leone are Immigrants from Afghanistan (11.4%, a difference of 0.050%), Immigrants from Iraq (11.4%, a difference of 0.11%), Sierra Leonean (11.4%, a difference of 0.33%), Immigrants from South America (11.3%, a difference of 0.43%), and Hawaiian (11.4%, a difference of 0.52%).
| Demographics | Rating | Rank | Male Poverty |
| Immigrants | Syria | 40.3 /100 | #179 | Average 11.3% |
| Immigrants | Morocco | 40.1 /100 | #180 | Average 11.3% |
| Immigrants | Costa Rica | 39.5 /100 | #181 | Fair 11.3% |
| Mongolians | 39.0 /100 | #182 | Fair 11.3% |
| Kenyans | 38.4 /100 | #183 | Fair 11.3% |
| Immigrants | South America | 36.9 /100 | #184 | Fair 11.3% |
| Immigrants | Afghanistan | 33.3 /100 | #185 | Fair 11.4% |
| Immigrants | Sierra Leone | 32.9 /100 | #186 | Fair 11.4% |
| Immigrants | Iraq | 31.9 /100 | #187 | Fair 11.4% |
| Sierra Leoneans | 29.9 /100 | #188 | Fair 11.4% |
| Hawaiians | 28.3 /100 | #189 | Fair 11.4% |
| Israelis | 26.1 /100 | #190 | Fair 11.5% |
| South American Indians | 22.8 /100 | #191 | Fair 11.5% |
| Immigrants | Uruguay | 19.1 /100 | #192 | Poor 11.6% |
| Immigrants | Kuwait | 17.3 /100 | #193 | Poor 11.6% |