Vietnamese vs Immigrants from Sierra Leone Male Poverty
COMPARE
Vietnamese
Immigrants from Sierra Leone
Male Poverty
Male Poverty Comparison
Vietnamese
Immigrants from Sierra Leone
13.8%
MALE POVERTY
0.0/ 100
METRIC RATING
291st/ 347
METRIC RANK
11.4%
MALE POVERTY
32.9/ 100
METRIC RATING
186th/ 347
METRIC RANK
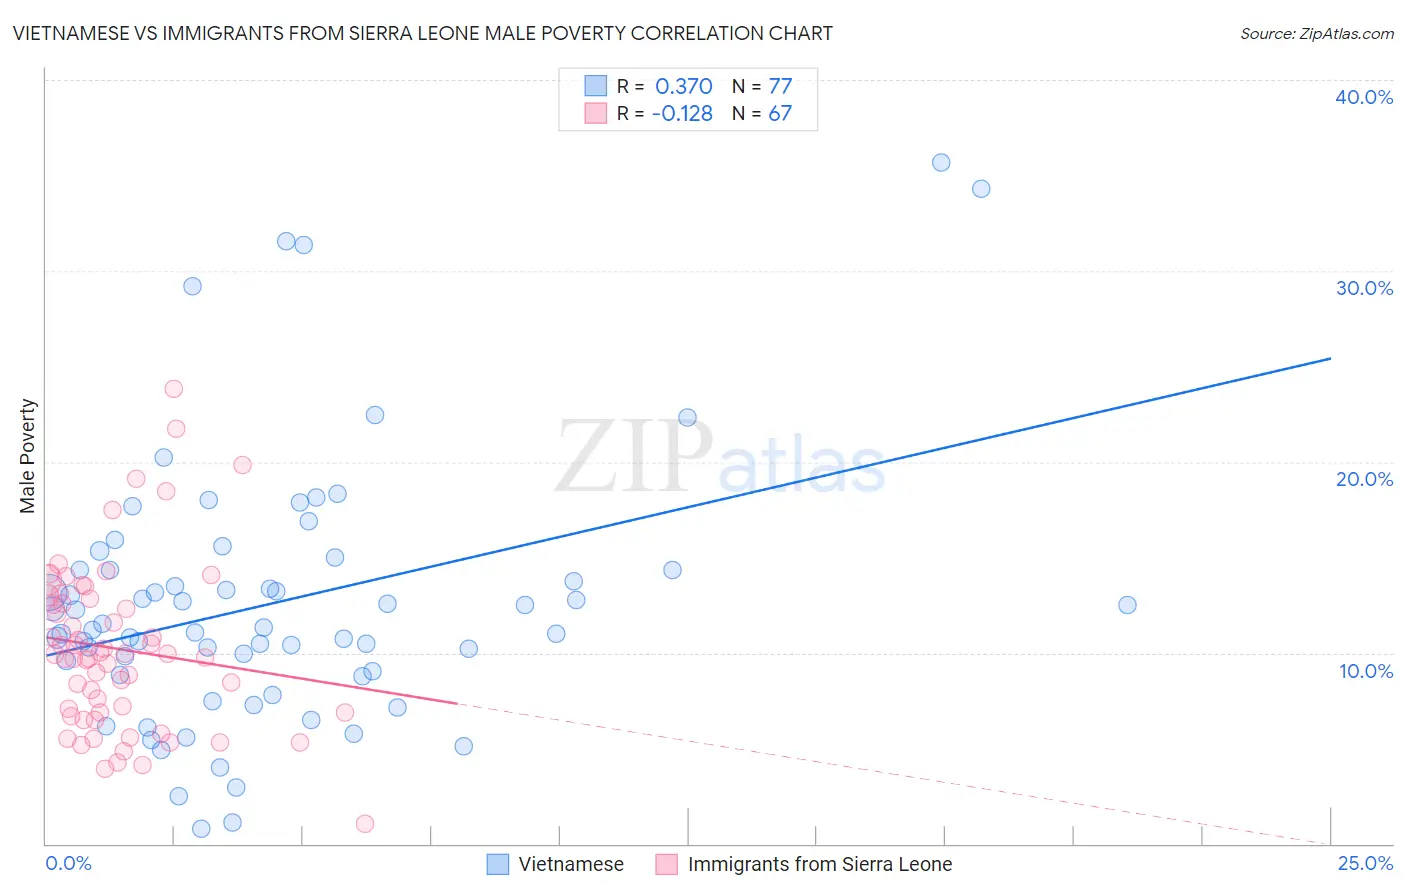
Vietnamese vs Immigrants from Sierra Leone Male Poverty Correlation Chart
The statistical analysis conducted on geographies consisting of 170,649,781 people shows a mild positive correlation between the proportion of Vietnamese and poverty level among males in the United States with a correlation coefficient (R) of 0.370 and weighted average of 13.8%. Similarly, the statistical analysis conducted on geographies consisting of 101,636,986 people shows a poor negative correlation between the proportion of Immigrants from Sierra Leone and poverty level among males in the United States with a correlation coefficient (R) of -0.128 and weighted average of 11.4%, a difference of 21.4%.
Male Poverty Correlation Summary
| Measurement | Vietnamese | Immigrants from Sierra Leone |
| Minimum | 0.78% | 1.0% |
| Maximum | 35.7% | 23.8% |
| Range | 34.9% | 22.8% |
| Mean | 12.6% | 10.2% |
| Median | 11.4% | 9.9% |
| Interquartile 25% (IQ1) | 8.9% | 6.9% |
| Interquartile 75% (IQ3) | 14.3% | 12.8% |
| Interquartile Range (IQR) | 5.4% | 5.9% |
| Standard Deviation (Sample) | 6.9% | 4.4% |
| Standard Deviation (Population) | 6.8% | 4.4% |
Similar Demographics by Male Poverty
Demographics Similar to Vietnamese by Male Poverty
In terms of male poverty, the demographic groups most similar to Vietnamese are Immigrants from Zaire (13.8%, a difference of 0.090%), Guatemalan (13.8%, a difference of 0.10%), Indonesian (13.8%, a difference of 0.17%), Immigrants from Belize (13.8%, a difference of 0.18%), and Hispanic or Latino (13.9%, a difference of 0.24%).
| Demographics | Rating | Rank | Male Poverty |
| Immigrants | Haiti | 0.0 /100 | #284 | Tragic 13.8% |
| West Indians | 0.0 /100 | #285 | Tragic 13.8% |
| Shoshone | 0.0 /100 | #286 | Tragic 13.8% |
| Immigrants | Barbados | 0.0 /100 | #287 | Tragic 13.8% |
| Immigrants | St. Vincent and the Grenadines | 0.0 /100 | #288 | Tragic 13.8% |
| Guatemalans | 0.0 /100 | #289 | Tragic 13.8% |
| Immigrants | Zaire | 0.0 /100 | #290 | Tragic 13.8% |
| Vietnamese | 0.0 /100 | #291 | Tragic 13.8% |
| Indonesians | 0.0 /100 | #292 | Tragic 13.8% |
| Immigrants | Belize | 0.0 /100 | #293 | Tragic 13.8% |
| Hispanics or Latinos | 0.0 /100 | #294 | Tragic 13.9% |
| Immigrants | Central America | 0.0 /100 | #295 | Tragic 13.9% |
| Cajuns | 0.0 /100 | #296 | Tragic 13.9% |
| Inupiat | 0.0 /100 | #297 | Tragic 14.0% |
| Blackfeet | 0.0 /100 | #298 | Tragic 14.0% |
Demographics Similar to Immigrants from Sierra Leone by Male Poverty
In terms of male poverty, the demographic groups most similar to Immigrants from Sierra Leone are Immigrants from Afghanistan (11.4%, a difference of 0.050%), Immigrants from Iraq (11.4%, a difference of 0.11%), Sierra Leonean (11.4%, a difference of 0.33%), Immigrants from South America (11.3%, a difference of 0.43%), and Hawaiian (11.4%, a difference of 0.52%).
| Demographics | Rating | Rank | Male Poverty |
| Immigrants | Syria | 40.3 /100 | #179 | Average 11.3% |
| Immigrants | Morocco | 40.1 /100 | #180 | Average 11.3% |
| Immigrants | Costa Rica | 39.5 /100 | #181 | Fair 11.3% |
| Mongolians | 39.0 /100 | #182 | Fair 11.3% |
| Kenyans | 38.4 /100 | #183 | Fair 11.3% |
| Immigrants | South America | 36.9 /100 | #184 | Fair 11.3% |
| Immigrants | Afghanistan | 33.3 /100 | #185 | Fair 11.4% |
| Immigrants | Sierra Leone | 32.9 /100 | #186 | Fair 11.4% |
| Immigrants | Iraq | 31.9 /100 | #187 | Fair 11.4% |
| Sierra Leoneans | 29.9 /100 | #188 | Fair 11.4% |
| Hawaiians | 28.3 /100 | #189 | Fair 11.4% |
| Israelis | 26.1 /100 | #190 | Fair 11.5% |
| South American Indians | 22.8 /100 | #191 | Fair 11.5% |
| Immigrants | Uruguay | 19.1 /100 | #192 | Poor 11.6% |
| Immigrants | Kuwait | 17.3 /100 | #193 | Poor 11.6% |