Basque vs Dominican Male Poverty
COMPARE
Basque
Dominican
Male Poverty
Male Poverty Comparison
Basques
Dominicans
10.9%
MALE POVERTY
74.6/ 100
METRIC RATING
142nd/ 347
METRIC RANK
16.1%
MALE POVERTY
0.0/ 100
METRIC RATING
329th/ 347
METRIC RANK
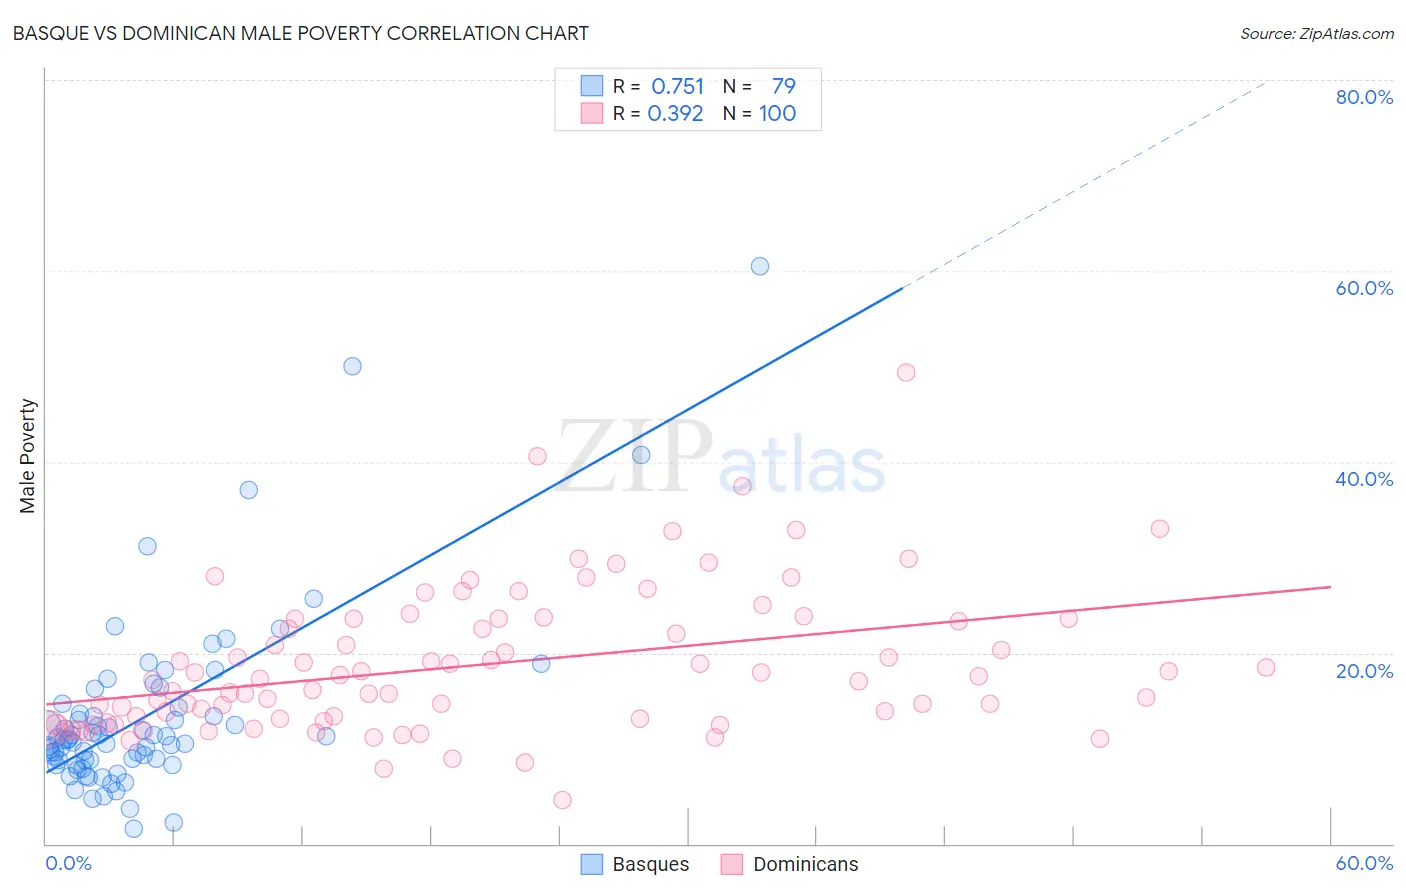
Basque vs Dominican Male Poverty Correlation Chart
The statistical analysis conducted on geographies consisting of 165,709,169 people shows a strong positive correlation between the proportion of Basques and poverty level among males in the United States with a correlation coefficient (R) of 0.751 and weighted average of 10.9%. Similarly, the statistical analysis conducted on geographies consisting of 354,651,464 people shows a mild positive correlation between the proportion of Dominicans and poverty level among males in the United States with a correlation coefficient (R) of 0.392 and weighted average of 16.1%, a difference of 47.6%.
Male Poverty Correlation Summary
| Measurement | Basque | Dominican |
| Minimum | 1.5% | 4.5% |
| Maximum | 60.5% | 49.4% |
| Range | 59.0% | 44.9% |
| Mean | 13.3% | 18.7% |
| Median | 10.9% | 17.2% |
| Interquartile 25% (IQ1) | 8.7% | 13.0% |
| Interquartile 75% (IQ3) | 14.3% | 23.5% |
| Interquartile Range (IQR) | 5.6% | 10.5% |
| Standard Deviation (Sample) | 9.6% | 7.5% |
| Standard Deviation (Population) | 9.5% | 7.5% |
Similar Demographics by Male Poverty
Demographics Similar to Basques by Male Poverty
In terms of male poverty, the demographic groups most similar to Basques are Immigrants from France (10.9%, a difference of 0.17%), Tlingit-Haida (10.9%, a difference of 0.20%), Afghan (10.9%, a difference of 0.34%), Samoan (10.9%, a difference of 0.36%), and Immigrants from Germany (10.9%, a difference of 0.38%).
| Demographics | Rating | Rank | Male Poverty |
| Brazilians | 82.7 /100 | #135 | Excellent 10.8% |
| Immigrants | Israel | 80.9 /100 | #136 | Excellent 10.8% |
| Immigrants | Switzerland | 79.2 /100 | #137 | Good 10.8% |
| Yugoslavians | 78.2 /100 | #138 | Good 10.8% |
| Immigrants | Jordan | 77.5 /100 | #139 | Good 10.8% |
| Tlingit-Haida | 76.1 /100 | #140 | Good 10.9% |
| Immigrants | France | 75.8 /100 | #141 | Good 10.9% |
| Basques | 74.6 /100 | #142 | Good 10.9% |
| Afghans | 71.9 /100 | #143 | Good 10.9% |
| Samoans | 71.8 /100 | #144 | Good 10.9% |
| Immigrants | Germany | 71.6 /100 | #145 | Good 10.9% |
| Syrians | 71.4 /100 | #146 | Good 10.9% |
| Icelanders | 68.5 /100 | #147 | Good 11.0% |
| Armenians | 68.0 /100 | #148 | Good 11.0% |
| Immigrants | Venezuela | 67.9 /100 | #149 | Good 11.0% |
Demographics Similar to Dominicans by Male Poverty
In terms of male poverty, the demographic groups most similar to Dominicans are Immigrants from Dominican Republic (16.2%, a difference of 0.65%), Ute (16.2%, a difference of 0.99%), Black/African American (15.8%, a difference of 1.7%), Paiute (15.8%, a difference of 1.8%), and Houma (16.7%, a difference of 4.0%).
| Demographics | Rating | Rank | Male Poverty |
| Kiowa | 0.0 /100 | #322 | Tragic 15.2% |
| Colville | 0.0 /100 | #323 | Tragic 15.2% |
| Menominee | 0.0 /100 | #324 | Tragic 15.3% |
| Yakama | 0.0 /100 | #325 | Tragic 15.3% |
| Central American Indians | 0.0 /100 | #326 | Tragic 15.3% |
| Paiute | 0.0 /100 | #327 | Tragic 15.8% |
| Blacks/African Americans | 0.0 /100 | #328 | Tragic 15.8% |
| Dominicans | 0.0 /100 | #329 | Tragic 16.1% |
| Immigrants | Dominican Republic | 0.0 /100 | #330 | Tragic 16.2% |
| Ute | 0.0 /100 | #331 | Tragic 16.2% |
| Houma | 0.0 /100 | #332 | Tragic 16.7% |
| Natives/Alaskans | 0.0 /100 | #333 | Tragic 16.9% |
| Cheyenne | 0.0 /100 | #334 | Tragic 17.6% |
| Apache | 0.0 /100 | #335 | Tragic 17.7% |
| Pueblo | 0.0 /100 | #336 | Tragic 18.5% |