Basque vs Cuban Male Poverty
COMPARE
Basque
Cuban
Male Poverty
Male Poverty Comparison
Basques
Cubans
10.9%
MALE POVERTY
74.6/ 100
METRIC RATING
142nd/ 347
METRIC RANK
12.4%
MALE POVERTY
1.3/ 100
METRIC RATING
229th/ 347
METRIC RANK
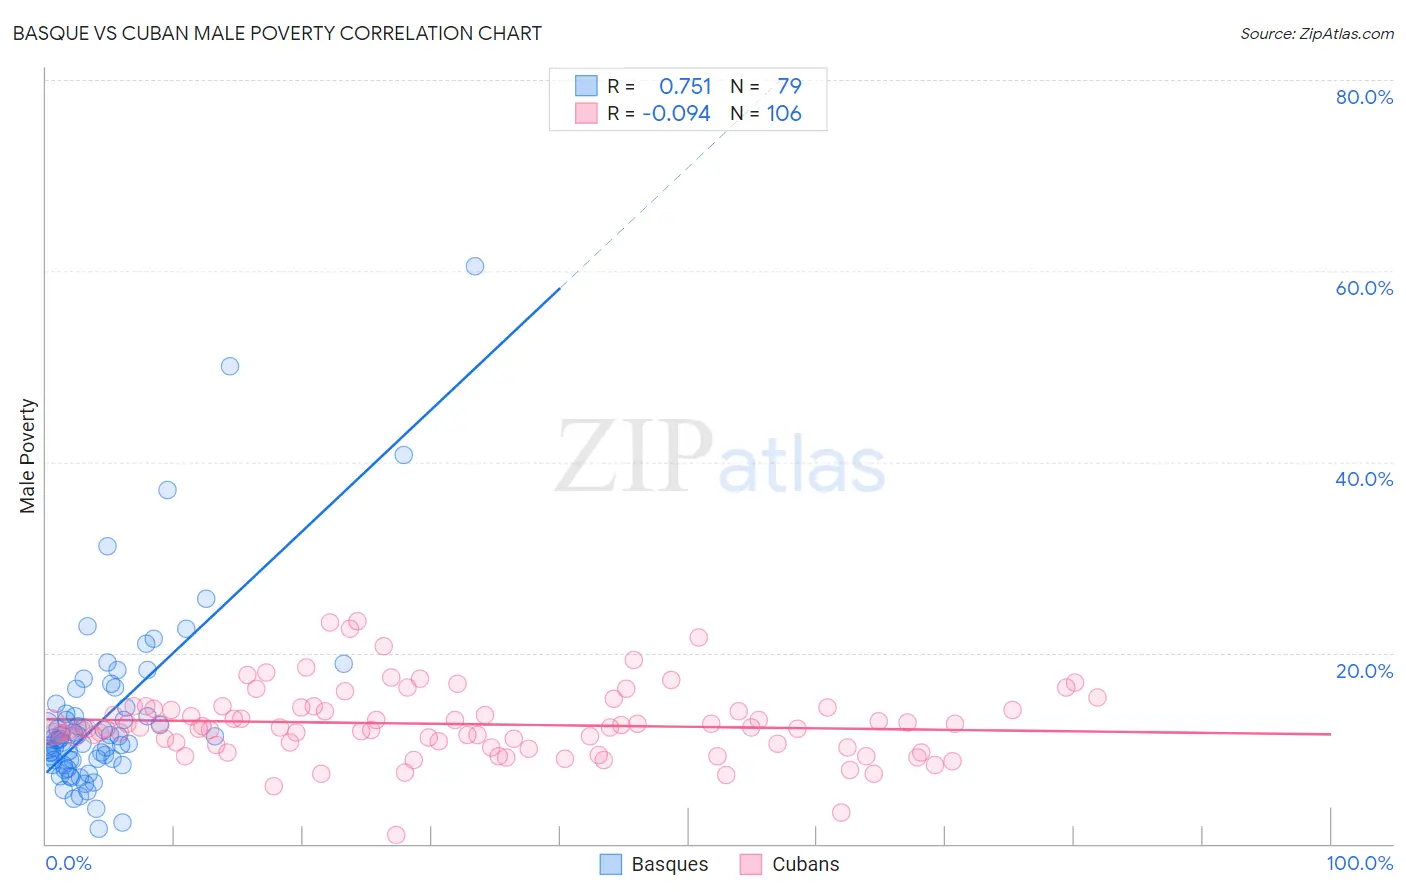
Basque vs Cuban Male Poverty Correlation Chart
The statistical analysis conducted on geographies consisting of 165,709,169 people shows a strong positive correlation between the proportion of Basques and poverty level among males in the United States with a correlation coefficient (R) of 0.751 and weighted average of 10.9%. Similarly, the statistical analysis conducted on geographies consisting of 448,765,698 people shows a slight negative correlation between the proportion of Cubans and poverty level among males in the United States with a correlation coefficient (R) of -0.094 and weighted average of 12.4%, a difference of 13.6%.
Male Poverty Correlation Summary
| Measurement | Basque | Cuban |
| Minimum | 1.5% | 0.97% |
| Maximum | 60.5% | 23.3% |
| Range | 59.0% | 22.4% |
| Mean | 13.3% | 12.5% |
| Median | 10.9% | 12.2% |
| Interquartile 25% (IQ1) | 8.7% | 10.5% |
| Interquartile 75% (IQ3) | 14.3% | 14.2% |
| Interquartile Range (IQR) | 5.6% | 3.8% |
| Standard Deviation (Sample) | 9.6% | 3.7% |
| Standard Deviation (Population) | 9.5% | 3.7% |
Similar Demographics by Male Poverty
Demographics Similar to Basques by Male Poverty
In terms of male poverty, the demographic groups most similar to Basques are Immigrants from France (10.9%, a difference of 0.17%), Tlingit-Haida (10.9%, a difference of 0.20%), Afghan (10.9%, a difference of 0.34%), Samoan (10.9%, a difference of 0.36%), and Immigrants from Germany (10.9%, a difference of 0.38%).
| Demographics | Rating | Rank | Male Poverty |
| Brazilians | 82.7 /100 | #135 | Excellent 10.8% |
| Immigrants | Israel | 80.9 /100 | #136 | Excellent 10.8% |
| Immigrants | Switzerland | 79.2 /100 | #137 | Good 10.8% |
| Yugoslavians | 78.2 /100 | #138 | Good 10.8% |
| Immigrants | Jordan | 77.5 /100 | #139 | Good 10.8% |
| Tlingit-Haida | 76.1 /100 | #140 | Good 10.9% |
| Immigrants | France | 75.8 /100 | #141 | Good 10.9% |
| Basques | 74.6 /100 | #142 | Good 10.9% |
| Afghans | 71.9 /100 | #143 | Good 10.9% |
| Samoans | 71.8 /100 | #144 | Good 10.9% |
| Immigrants | Germany | 71.6 /100 | #145 | Good 10.9% |
| Syrians | 71.4 /100 | #146 | Good 10.9% |
| Icelanders | 68.5 /100 | #147 | Good 11.0% |
| Armenians | 68.0 /100 | #148 | Good 11.0% |
| Immigrants | Venezuela | 67.9 /100 | #149 | Good 11.0% |
Demographics Similar to Cubans by Male Poverty
In terms of male poverty, the demographic groups most similar to Cubans are Alsatian (12.4%, a difference of 0.090%), Alaska Native (12.4%, a difference of 0.13%), Nigerian (12.3%, a difference of 0.23%), Osage (12.3%, a difference of 0.39%), and Immigrants from Nigeria (12.3%, a difference of 0.45%).
| Demographics | Rating | Rank | Male Poverty |
| Immigrants | Africa | 2.1 /100 | #222 | Tragic 12.2% |
| Immigrants | Micronesia | 2.1 /100 | #223 | Tragic 12.2% |
| Immigrants | Nigeria | 1.6 /100 | #224 | Tragic 12.3% |
| Osage | 1.5 /100 | #225 | Tragic 12.3% |
| Nigerians | 1.4 /100 | #226 | Tragic 12.3% |
| Alaska Natives | 1.4 /100 | #227 | Tragic 12.4% |
| Alsatians | 1.3 /100 | #228 | Tragic 12.4% |
| Cubans | 1.3 /100 | #229 | Tragic 12.4% |
| Marshallese | 0.8 /100 | #230 | Tragic 12.5% |
| Salvadorans | 0.6 /100 | #231 | Tragic 12.6% |
| Nicaraguans | 0.6 /100 | #232 | Tragic 12.6% |
| Fijians | 0.6 /100 | #233 | Tragic 12.6% |
| Immigrants | Armenia | 0.6 /100 | #234 | Tragic 12.6% |
| Immigrants | Laos | 0.5 /100 | #235 | Tragic 12.6% |
| Immigrants | Saudi Arabia | 0.4 /100 | #236 | Tragic 12.7% |