Basque vs Immigrants from Caribbean Male Poverty
COMPARE
Basque
Immigrants from Caribbean
Male Poverty
Male Poverty Comparison
Basques
Immigrants from Caribbean
10.9%
MALE POVERTY
74.6/ 100
METRIC RATING
142nd/ 347
METRIC RANK
14.0%
MALE POVERTY
0.0/ 100
METRIC RATING
302nd/ 347
METRIC RANK
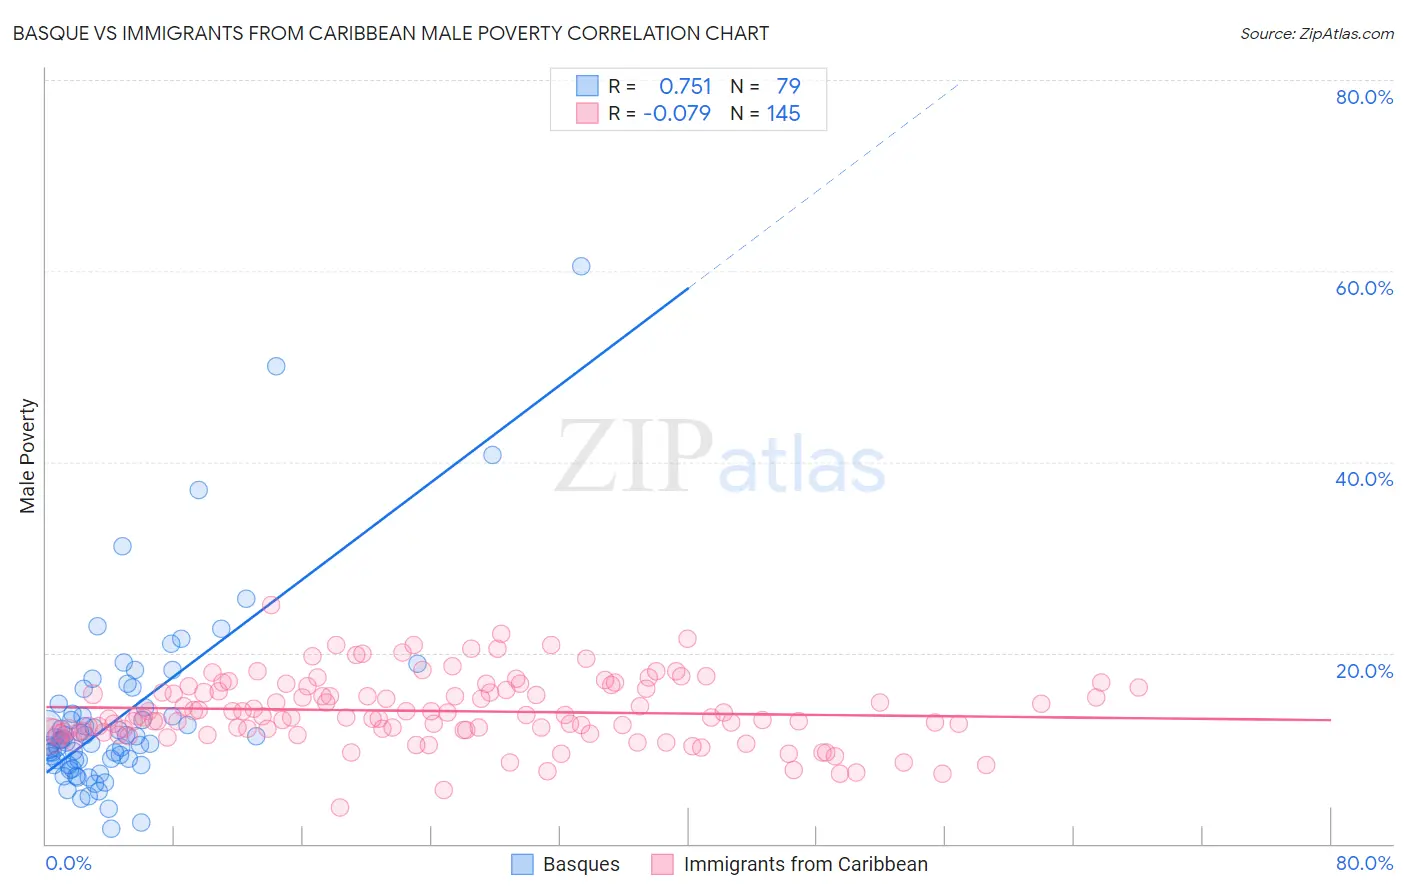
Basque vs Immigrants from Caribbean Male Poverty Correlation Chart
The statistical analysis conducted on geographies consisting of 165,709,169 people shows a strong positive correlation between the proportion of Basques and poverty level among males in the United States with a correlation coefficient (R) of 0.751 and weighted average of 10.9%. Similarly, the statistical analysis conducted on geographies consisting of 449,415,069 people shows a slight negative correlation between the proportion of Immigrants from Caribbean and poverty level among males in the United States with a correlation coefficient (R) of -0.079 and weighted average of 14.0%, a difference of 29.0%.
Male Poverty Correlation Summary
| Measurement | Basque | Immigrants from Caribbean |
| Minimum | 1.5% | 3.7% |
| Maximum | 60.5% | 25.0% |
| Range | 59.0% | 21.3% |
| Mean | 13.3% | 13.9% |
| Median | 10.9% | 13.3% |
| Interquartile 25% (IQ1) | 8.7% | 11.8% |
| Interquartile 75% (IQ3) | 14.3% | 16.3% |
| Interquartile Range (IQR) | 5.6% | 4.5% |
| Standard Deviation (Sample) | 9.6% | 3.5% |
| Standard Deviation (Population) | 9.5% | 3.5% |
Similar Demographics by Male Poverty
Demographics Similar to Basques by Male Poverty
In terms of male poverty, the demographic groups most similar to Basques are Immigrants from France (10.9%, a difference of 0.17%), Tlingit-Haida (10.9%, a difference of 0.20%), Afghan (10.9%, a difference of 0.34%), Samoan (10.9%, a difference of 0.36%), and Immigrants from Germany (10.9%, a difference of 0.38%).
| Demographics | Rating | Rank | Male Poverty |
| Brazilians | 82.7 /100 | #135 | Excellent 10.8% |
| Immigrants | Israel | 80.9 /100 | #136 | Excellent 10.8% |
| Immigrants | Switzerland | 79.2 /100 | #137 | Good 10.8% |
| Yugoslavians | 78.2 /100 | #138 | Good 10.8% |
| Immigrants | Jordan | 77.5 /100 | #139 | Good 10.8% |
| Tlingit-Haida | 76.1 /100 | #140 | Good 10.9% |
| Immigrants | France | 75.8 /100 | #141 | Good 10.9% |
| Basques | 74.6 /100 | #142 | Good 10.9% |
| Afghans | 71.9 /100 | #143 | Good 10.9% |
| Samoans | 71.8 /100 | #144 | Good 10.9% |
| Immigrants | Germany | 71.6 /100 | #145 | Good 10.9% |
| Syrians | 71.4 /100 | #146 | Good 10.9% |
| Icelanders | 68.5 /100 | #147 | Good 11.0% |
| Armenians | 68.0 /100 | #148 | Good 11.0% |
| Immigrants | Venezuela | 67.9 /100 | #149 | Good 11.0% |
Demographics Similar to Immigrants from Caribbean by Male Poverty
In terms of male poverty, the demographic groups most similar to Immigrants from Caribbean are Bahamian (14.1%, a difference of 0.040%), Immigrants from Senegal (14.0%, a difference of 0.060%), Immigrants from Mexico (14.0%, a difference of 0.13%), Senegalese (14.1%, a difference of 0.14%), and Immigrants from Guatemala (14.0%, a difference of 0.24%).
| Demographics | Rating | Rank | Male Poverty |
| Immigrants | Central America | 0.0 /100 | #295 | Tragic 13.9% |
| Cajuns | 0.0 /100 | #296 | Tragic 13.9% |
| Inupiat | 0.0 /100 | #297 | Tragic 14.0% |
| Blackfeet | 0.0 /100 | #298 | Tragic 14.0% |
| Immigrants | Guatemala | 0.0 /100 | #299 | Tragic 14.0% |
| Immigrants | Mexico | 0.0 /100 | #300 | Tragic 14.0% |
| Immigrants | Senegal | 0.0 /100 | #301 | Tragic 14.0% |
| Immigrants | Caribbean | 0.0 /100 | #302 | Tragic 14.0% |
| Bahamians | 0.0 /100 | #303 | Tragic 14.1% |
| Senegalese | 0.0 /100 | #304 | Tragic 14.1% |
| Immigrants | Bangladesh | 0.0 /100 | #305 | Tragic 14.1% |
| Creek | 0.0 /100 | #306 | Tragic 14.1% |
| Dutch West Indians | 0.0 /100 | #307 | Tragic 14.2% |
| Africans | 0.0 /100 | #308 | Tragic 14.2% |
| Somalis | 0.0 /100 | #309 | Tragic 14.3% |