Immigrants from Burma/Myanmar vs Cuban Male Poverty

COMPARE

Immigrants from Burma/Myanmar
Race
Ancestry
AfghanAfricanAlaska NativeAlaskan AthabascanAlbanianAleutAlsatianAmericanApacheArabArapahoArgentineanArmenianAssyrian/Chaldean/SyriacAustralianAustrianBahamianBangladeshiBarbadianBasqueBelgianBelizeanBermudanBhutaneseBlackfeetBolivianBrazilianBritishBritish West IndianBulgarianBurmeseCajunCambodianCanadianCape VerdeanCarpatho RusynCelticCentral AmericanCentral American IndianCherokeeCheyenneChickasawChileanChineseChippewaChoctawColombianColvilleComancheCosta RicanCreeCreekCroatianCrowCypriotCzechCzechoslovakianDanishDelawareDominicanDutchDutch West IndianEastern EuropeanEcuadorianEgyptianEnglishEstonianEthiopianEuropeanFijianFilipinoFinnishFrenchFrench American IndianFrench CanadianGermanGerman RussianGhanaianGreekGuamanian/ChamorroGuatemalanGuyaneseHaitianHmongHonduranHopiHoumaHungarianIcelanderIndian (Asian)IndonesianInupiatIranianIraqiIrishIroquoisIsraeliItalianJamaicanJapaneseJordanianKenyanKiowaKoreanLaotianLatvianLebaneseLiberianLithuanianLumbeeLuxembourgerMacedonianMalaysianMalteseMarshalleseMenomineeMexicanMexican American IndianMongolianMoroccanNative HawaiianNavajoNepaleseNew ZealanderNicaraguanNigerianNorthern EuropeanNorwegianOkinawanOsageOttawaPaiutePakistaniPalestinianPanamanianParaguayanPennsylvania GermanPeruvianPimaPolishPortuguesePotawatomiPuebloPuerto RicanPuget Sound SalishRomanianRussianSalvadoranSamoanScandinavianScotch-IrishScottishSeminoleSenegaleseSerbianShoshoneSierra LeoneanSiouxSlavicSlovakSloveneSomaliSouth AfricanSouth AmericanSouth American IndianSoviet UnionSpaniardSpanishSpanish AmericanSpanish American IndianSri LankanSubsaharan AfricanSudaneseSwedishSwissSyrianTaiwaneseThaiTlingit-HaidaTohono O'OdhamTonganTrinidadian and TobagonianTsimshianTurkishU.S. Virgin IslanderUgandanUkrainianUruguayanUteVenezuelanVietnameseWelshWest IndianYakamaYaquiYugoslavianYumanYup'ikZimbabwean
Immigration
NonimmigrantsImmigrantsAfghanistanAfricaAlbaniaArgentinaArmeniaAsiaAustraliaAustriaBahamasBangladeshBarbadosBelarusBelgiumBelizeBoliviaBosnia and HerzegovinaBrazilBulgariaBurma/MyanmarCabo VerdeCambodiaCameroonCanadaCaribbeanCentral AmericaChileChinaColombiaCongoCosta RicaCroatiaCubaCzechoslovakiaDenmarkDominicaDominican RepublicEastern AfricaEastern AsiaEastern EuropeEcuadorEgyptEl SalvadorEnglandEritreaEthiopiaEuropeFijiFranceGermanyGhanaGreeceGrenadaGuatemalaGuyanaHaitiHondurasHong KongHungaryIndiaIndonesiaIranIraqIrelandIsraelItalyJamaicaJapanJordanKazakhstanKenyaKoreaKuwaitLaosLatin AmericaLatviaLebanonLiberiaLithuaniaMalaysiaMexicoMicronesiaMiddle AfricaMoldovaMoroccoNepalNetherlandsNicaraguaNigeriaNorth AmericaNorth MacedoniaNorthern AfricaNorthern EuropeNorwayOceaniaPakistanPanamaPeruPhilippinesPolandPortugalRomaniaRussiaSaudi ArabiaScotlandSenegalSerbiaSierra LeoneSingaporeSomaliaSouth AfricaSouth AmericaSouth Central AsiaSouth Eastern AsiaSouthern EuropeSpainSri LankaSt. Vincent and the GrenadinesSudanSwedenSwitzerlandSyriaTaiwanThailandTrinidad and TobagoTurkeyUgandaUkraineUruguayUzbekistanVenezuelaVietnamWest IndiesWestern AfricaWestern AsiaWestern EuropeYemenZaireZimbabweAzores
Cuban
Race
Ancestry
AfghanAfricanAlaska NativeAlaskan AthabascanAlbanianAleutAlsatianAmericanApacheArabArapahoArgentineanArmenianAssyrian/Chaldean/SyriacAustralianAustrianBahamianBangladeshiBarbadianBasqueBelgianBelizeanBermudanBhutaneseBlackfeetBolivianBrazilianBritishBritish West IndianBulgarianBurmeseCajunCambodianCanadianCape VerdeanCarpatho RusynCelticCentral AmericanCentral American IndianCherokeeCheyenneChickasawChileanChineseChippewaChoctawColombianColvilleComancheCosta RicanCreeCreekCroatianCrowCubanCypriotCzechCzechoslovakianDanishDelawareDominicanDutchDutch West IndianEastern EuropeanEcuadorianEgyptianEnglishEstonianEthiopianEuropeanFijianFilipinoFinnishFrenchFrench American IndianFrench CanadianGermanGerman RussianGhanaianGreekGuamanian/ChamorroGuatemalanGuyaneseHaitianHmongHonduranHopiHoumaHungarianIcelanderIndian (Asian)IndonesianInupiatIranianIraqiIrishIroquoisIsraeliItalianJamaicanJapaneseJordanianKenyanKiowaKoreanLaotianLatvianLebaneseLiberianLithuanianLumbeeLuxembourgerMacedonianMalaysianMalteseMarshalleseMenomineeMexicanMexican American IndianMongolianMoroccanNative HawaiianNavajoNepaleseNew ZealanderNicaraguanNigerianNorthern EuropeanNorwegianOkinawanOsageOttawaPaiutePakistaniPalestinianPanamanianParaguayanPennsylvania GermanPeruvianPimaPolishPortuguesePotawatomiPuebloPuerto RicanPuget Sound SalishRomanianRussianSalvadoranSamoanScandinavianScotch-IrishScottishSeminoleSenegaleseSerbianShoshoneSierra LeoneanSiouxSlavicSlovakSloveneSomaliSouth AfricanSouth AmericanSouth American IndianSoviet UnionSpaniardSpanishSpanish AmericanSpanish American IndianSri LankanSubsaharan AfricanSudaneseSwedishSwissSyrianTaiwaneseThaiTlingit-HaidaTohono O'OdhamTonganTrinidadian and TobagonianTsimshianTurkishU.S. Virgin IslanderUgandanUkrainianUruguayanUteVenezuelanVietnameseWelshWest IndianYakamaYaquiYugoslavianYumanYup'ikZimbabwean
Immigration
NonimmigrantsImmigrantsAfghanistanAfricaAlbaniaArgentinaArmeniaAsiaAustraliaAustriaBahamasBangladeshBarbadosBelarusBelgiumBelizeBoliviaBosnia and HerzegovinaBrazilBulgariaCabo VerdeCambodiaCameroonCanadaCaribbeanCentral AmericaChileChinaColombiaCongoCosta RicaCroatiaCubaCzechoslovakiaDenmarkDominicaDominican RepublicEastern AfricaEastern AsiaEastern EuropeEcuadorEgyptEl SalvadorEnglandEritreaEthiopiaEuropeFijiFranceGermanyGhanaGreeceGrenadaGuatemalaGuyanaHaitiHondurasHong KongHungaryIndiaIndonesiaIranIraqIrelandIsraelItalyJamaicaJapanJordanKazakhstanKenyaKoreaKuwaitLaosLatin AmericaLatviaLebanonLiberiaLithuaniaMalaysiaMexicoMicronesiaMiddle AfricaMoldovaMoroccoNepalNetherlandsNicaraguaNigeriaNorth AmericaNorth MacedoniaNorthern AfricaNorthern EuropeNorwayOceaniaPakistanPanamaPeruPhilippinesPolandPortugalRomaniaRussiaSaudi ArabiaScotlandSenegalSerbiaSierra LeoneSingaporeSomaliaSouth AfricaSouth AmericaSouth Central AsiaSouth Eastern AsiaSouthern EuropeSpainSri LankaSt. Vincent and the GrenadinesSudanSwedenSwitzerlandSyriaTaiwanThailandTrinidad and TobagoTurkeyUgandaUkraineUruguayUzbekistanVenezuelaVietnamWest IndiesWestern AfricaWestern AsiaWestern EuropeYemenZaireZimbabweAzores
Male Poverty
Income
Poverty
Unemployment
Labor Participation
Family Structure
Vehicle Availability
Education Level
Disability

Male Poverty Comparison

Immigrants from Burma/Myanmar

Cubans

Tragic
Tragic
13.0%
MALE POVERTY
0.1/ 100
METRIC RATING
256th/ 347
METRIC RANK
12.4%
MALE POVERTY
1.3/ 100
METRIC RATING
229th/ 347
METRIC RANK

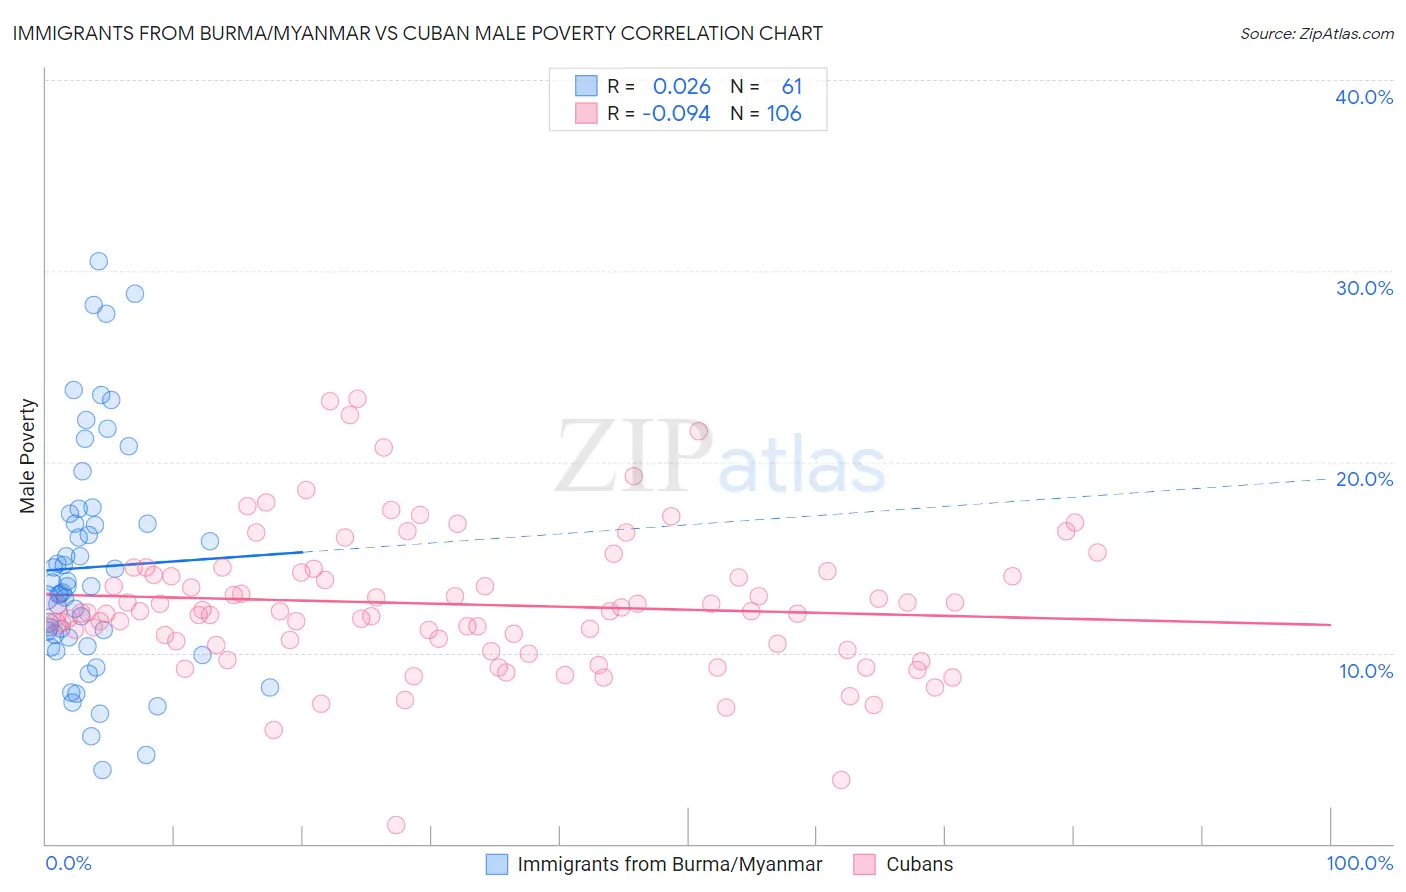
Immigrants from Burma/Myanmar vs Cuban Male Poverty Correlation Chart

The statistical analysis conducted on geographies consisting of 172,258,093 people shows no correlation between the proportion of Immigrants from Burma/Myanmar and poverty level among males in the United States with a correlation coefficient (R) of 0.026 and weighted average of 13.0%. Similarly, the statistical analysis conducted on geographies consisting of 448,765,698 people shows a slight negative correlation between the proportion of Cubans and poverty level among males in the United States with a correlation coefficient (R) of -0.094 and weighted average of 12.4%, a difference of 5.2%.
Immigrants from Burma/Myanmar vs Cuban Male Poverty

Male Poverty Correlation Summary

MeasurementImmigrants from Burma/MyanmarCuban
Minimum3.9%0.97%
Maximum30.5%23.3%
Range26.6%22.4%
Mean14.5%12.5%
Median13.5%12.2%
Interquartile 25% (IQ1)10.6%10.5%
Interquartile 75% (IQ3)17.0%14.2%
Interquartile Range (IQR)6.5%3.8%
Standard Deviation (Sample)6.0%3.7%
Standard Deviation (Population)5.9%3.7%

Similar Demographics by Male Poverty

Demographics Similar to Immigrants from Burma/Myanmar by Male Poverty

In terms of male poverty, the demographic groups most similar to Immigrants from Burma/Myanmar are Immigrants from Liberia (13.0%, a difference of 0.20%), Immigrants from Trinidad and Tobago (13.1%, a difference of 0.26%), Mexican American Indian (13.0%, a difference of 0.29%), Cape Verdean (13.1%, a difference of 0.39%), and Cherokee (13.1%, a difference of 0.55%).
DemographicsRating | RankMale Poverty
Potawatomi
0.2
/100
|
#249
Tragic
12.9%
Immigrants | Nicaragua
0.2
/100
|
#250
Tragic
12.9%
Immigrants | Cuba
0.2
/100
|
#251
Tragic
12.9%
Immigrants | Ecuador
0.2
/100
|
#252
Tragic
12.9%
Immigrants | Ghana
0.2
/100
|
#253
Tragic
12.9%
Mexican American Indians
0.1
/100
|
#254
Tragic
13.0%
Immigrants | Liberia
0.1
/100
|
#255
Tragic
13.0%
Immigrants | Burma/Myanmar
0.1
/100
|
#256
Tragic
13.0%
Immigrants | Trinidad and Tobago
0.1
/100
|
#257
Tragic
13.1%
Cape Verdeans
0.1
/100
|
#258
Tragic
13.1%
Cherokee
0.1
/100
|
#259
Tragic
13.1%
Ottawa
0.1
/100
|
#260
Tragic
13.1%
Trinidadians and Tobagonians
0.1
/100
|
#261
Tragic
13.1%
Spanish American Indians
0.1
/100
|
#262
Tragic
13.1%
Central Americans
0.1
/100
|
#263
Tragic
13.2%

Demographics Similar to Cubans by Male Poverty

In terms of male poverty, the demographic groups most similar to Cubans are Alsatian (12.4%, a difference of 0.090%), Alaska Native (12.4%, a difference of 0.13%), Nigerian (12.3%, a difference of 0.23%), Osage (12.3%, a difference of 0.39%), and Immigrants from Nigeria (12.3%, a difference of 0.45%).
DemographicsRating | RankMale Poverty
Immigrants | Africa
2.1
/100
|
#222
Tragic
12.2%
Immigrants | Micronesia
2.1
/100
|
#223
Tragic
12.2%
Immigrants | Nigeria
1.6
/100
|
#224
Tragic
12.3%
Osage
1.5
/100
|
#225
Tragic
12.3%
Nigerians
1.4
/100
|
#226
Tragic
12.3%
Alaska Natives
1.4
/100
|
#227
Tragic
12.4%
Alsatians
1.3
/100
|
#228
Tragic
12.4%
Cubans
1.3
/100
|
#229
Tragic
12.4%
Marshallese
0.8
/100
|
#230
Tragic
12.5%
Salvadorans
0.6
/100
|
#231
Tragic
12.6%
Nicaraguans
0.6
/100
|
#232
Tragic
12.6%
Fijians
0.6
/100
|
#233
Tragic
12.6%
Immigrants | Armenia
0.6
/100
|
#234
Tragic
12.6%
Immigrants | Laos
0.5
/100
|
#235
Tragic
12.6%
Immigrants | Saudi Arabia
0.4
/100
|
#236
Tragic
12.7%