Immigrants from West Indies vs Tohono O'odham Family Poverty
COMPARE
Immigrants from West Indies
Tohono O'odham
Family Poverty
Family Poverty Comparison
Immigrants from West Indies
Tohono O'odham
11.3%
FAMILY POVERTY
0.0/ 100
METRIC RATING
281st/ 347
METRIC RANK
20.4%
FAMILY POVERTY
0.0/ 100
METRIC RATING
347th/ 347
METRIC RANK
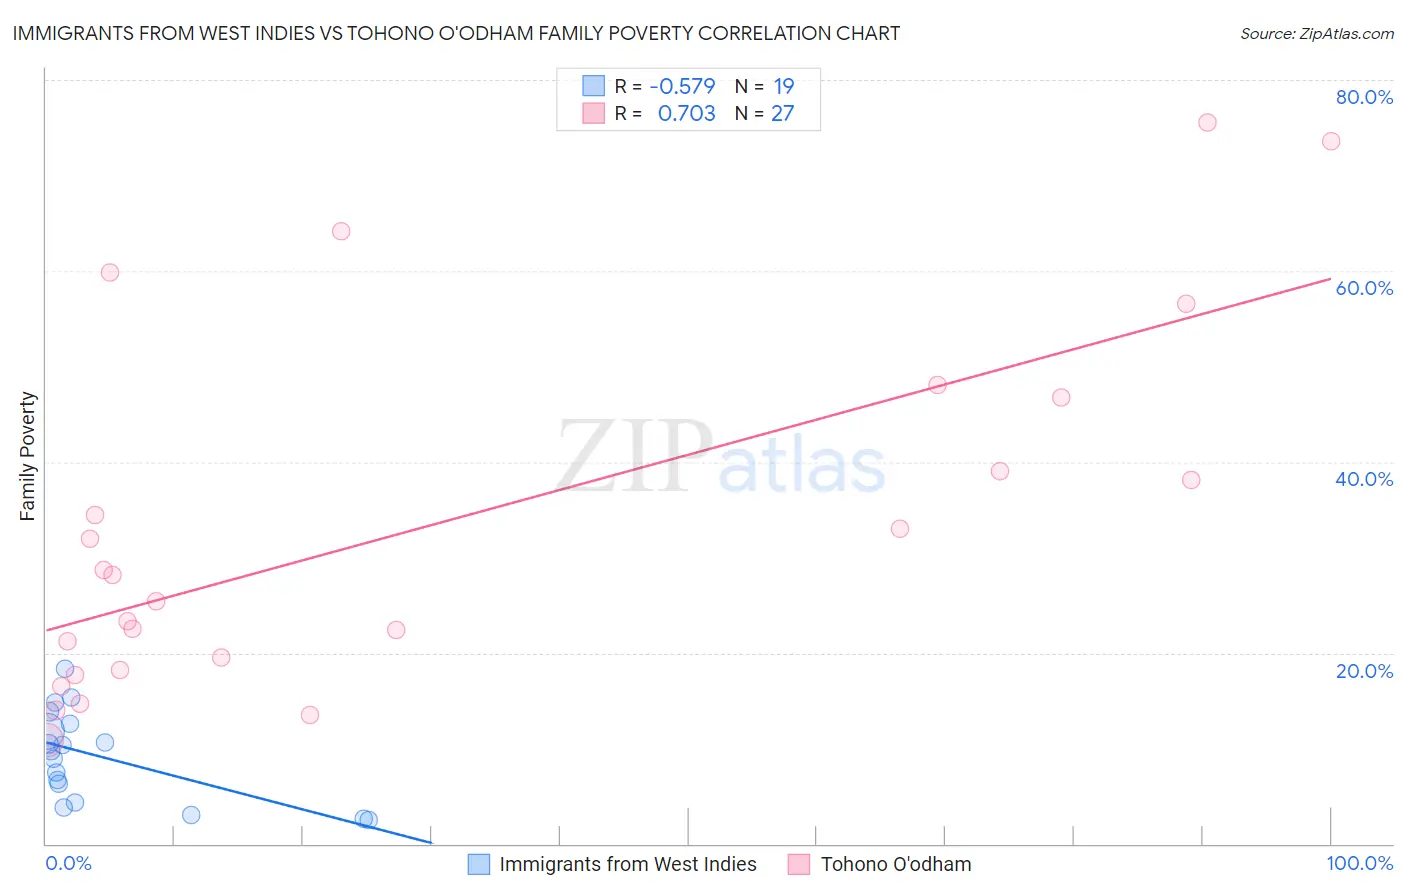
Immigrants from West Indies vs Tohono O'odham Family Poverty Correlation Chart
The statistical analysis conducted on geographies consisting of 72,448,648 people shows a substantial negative correlation between the proportion of Immigrants from West Indies and poverty level among families in the United States with a correlation coefficient (R) of -0.579 and weighted average of 11.3%. Similarly, the statistical analysis conducted on geographies consisting of 58,710,760 people shows a strong positive correlation between the proportion of Tohono O'odham and poverty level among families in the United States with a correlation coefficient (R) of 0.703 and weighted average of 20.4%, a difference of 80.6%.
Family Poverty Correlation Summary
| Measurement | Immigrants from West Indies | Tohono O'odham |
| Minimum | 2.5% | 10.9% |
| Maximum | 18.3% | 75.6% |
| Range | 15.8% | 64.7% |
| Mean | 9.1% | 33.2% |
| Median | 9.7% | 28.2% |
| Interquartile 25% (IQ1) | 4.4% | 18.3% |
| Interquartile 75% (IQ3) | 12.6% | 46.7% |
| Interquartile Range (IQR) | 8.2% | 28.5% |
| Standard Deviation (Sample) | 4.7% | 18.8% |
| Standard Deviation (Population) | 4.5% | 18.5% |
Similar Demographics by Family Poverty
Demographics Similar to Immigrants from West Indies by Family Poverty
In terms of family poverty, the demographic groups most similar to Immigrants from West Indies are Immigrants from Cuba (11.3%, a difference of 0.26%), Belizean (11.3%, a difference of 0.27%), Indonesian (11.3%, a difference of 0.30%), Blackfeet (11.3%, a difference of 0.31%), and Yaqui (11.3%, a difference of 0.42%).
| Demographics | Rating | Rank | Family Poverty |
| Spanish Americans | 0.1 /100 | #274 | Tragic 11.2% |
| Central Americans | 0.1 /100 | #275 | Tragic 11.2% |
| Immigrants | Guyana | 0.1 /100 | #276 | Tragic 11.2% |
| Chippewa | 0.1 /100 | #277 | Tragic 11.2% |
| Guyanese | 0.1 /100 | #278 | Tragic 11.2% |
| Blackfeet | 0.0 /100 | #279 | Tragic 11.3% |
| Belizeans | 0.0 /100 | #280 | Tragic 11.3% |
| Immigrants | West Indies | 0.0 /100 | #281 | Tragic 11.3% |
| Immigrants | Cuba | 0.0 /100 | #282 | Tragic 11.3% |
| Indonesians | 0.0 /100 | #283 | Tragic 11.3% |
| Yaqui | 0.0 /100 | #284 | Tragic 11.3% |
| Barbadians | 0.0 /100 | #285 | Tragic 11.3% |
| Senegalese | 0.0 /100 | #286 | Tragic 11.5% |
| Vietnamese | 0.0 /100 | #287 | Tragic 11.5% |
| Immigrants | Belize | 0.0 /100 | #288 | Tragic 11.5% |
Demographics Similar to Tohono O'odham by Family Poverty
In terms of family poverty, the demographic groups most similar to Tohono O'odham are Puerto Rican (20.3%, a difference of 0.37%), Navajo (18.8%, a difference of 8.5%), Yup'ik (18.7%, a difference of 9.0%), Pima (18.4%, a difference of 11.1%), and Immigrants from Yemen (17.5%, a difference of 16.8%).
| Demographics | Rating | Rank | Family Poverty |
| Immigrants | Dominican Republic | 0.0 /100 | #333 | Tragic 14.4% |
| Houma | 0.0 /100 | #334 | Tragic 14.6% |
| Apache | 0.0 /100 | #335 | Tragic 14.7% |
| Sioux | 0.0 /100 | #336 | Tragic 15.9% |
| Hopi | 0.0 /100 | #337 | Tragic 15.9% |
| Crow | 0.0 /100 | #338 | Tragic 16.1% |
| Yuman | 0.0 /100 | #339 | Tragic 16.6% |
| Pueblo | 0.0 /100 | #340 | Tragic 17.0% |
| Lumbee | 0.0 /100 | #341 | Tragic 17.0% |
| Immigrants | Yemen | 0.0 /100 | #342 | Tragic 17.5% |
| Pima | 0.0 /100 | #343 | Tragic 18.4% |
| Yup'ik | 0.0 /100 | #344 | Tragic 18.7% |
| Navajo | 0.0 /100 | #345 | Tragic 18.8% |
| Puerto Ricans | 0.0 /100 | #346 | Tragic 20.3% |
| Tohono O'odham | 0.0 /100 | #347 | Tragic 20.4% |