Assyrian/Chaldean/Syriac vs Immigrants from Portugal Family Poverty
COMPARE
Assyrian/Chaldean/Syriac
Immigrants from Portugal
Family Poverty
Family Poverty Comparison
Assyrians/Chaldeans/Syriacs
Immigrants from Portugal
7.3%
FAMILY POVERTY
99.7/ 100
METRIC RATING
23rd/ 347
METRIC RANK
9.4%
FAMILY POVERTY
20.5/ 100
METRIC RATING
201st/ 347
METRIC RANK
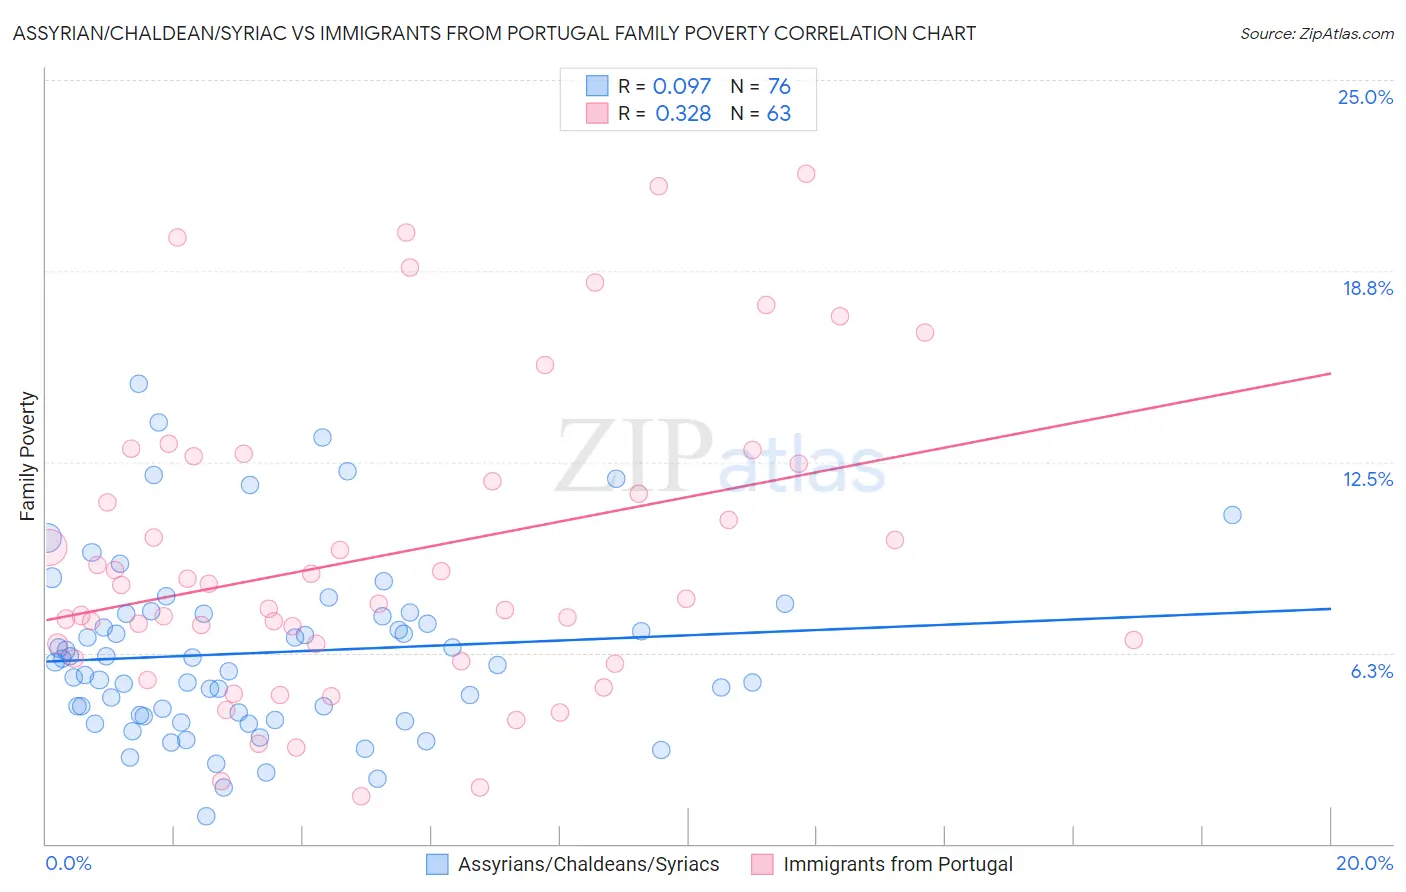
Assyrian/Chaldean/Syriac vs Immigrants from Portugal Family Poverty Correlation Chart
The statistical analysis conducted on geographies consisting of 110,238,893 people shows a slight positive correlation between the proportion of Assyrians/Chaldeans/Syriacs and poverty level among families in the United States with a correlation coefficient (R) of 0.097 and weighted average of 7.3%. Similarly, the statistical analysis conducted on geographies consisting of 174,489,914 people shows a mild positive correlation between the proportion of Immigrants from Portugal and poverty level among families in the United States with a correlation coefficient (R) of 0.328 and weighted average of 9.4%, a difference of 28.8%.
Family Poverty Correlation Summary
| Measurement | Assyrian/Chaldean/Syriac | Immigrants from Portugal |
| Minimum | 0.89% | 1.6% |
| Maximum | 15.1% | 21.9% |
| Range | 14.2% | 20.4% |
| Mean | 6.3% | 9.4% |
| Median | 5.9% | 8.0% |
| Interquartile 25% (IQ1) | 4.2% | 6.1% |
| Interquartile 75% (IQ3) | 7.5% | 12.5% |
| Interquartile Range (IQR) | 3.3% | 6.4% |
| Standard Deviation (Sample) | 2.9% | 5.0% |
| Standard Deviation (Population) | 2.9% | 4.9% |
Similar Demographics by Family Poverty
Demographics Similar to Assyrians/Chaldeans/Syriacs by Family Poverty
In terms of family poverty, the demographic groups most similar to Assyrians/Chaldeans/Syriacs are Danish (7.3%, a difference of 0.010%), Croatian (7.3%, a difference of 0.30%), Burmese (7.3%, a difference of 0.30%), Immigrants from Iran (7.3%, a difference of 0.45%), and Cypriot (7.3%, a difference of 0.55%).
| Demographics | Rating | Rank | Family Poverty |
| Immigrants | South Central Asia | 99.8 /100 | #16 | Exceptional 7.2% |
| Luxembourgers | 99.8 /100 | #17 | Exceptional 7.2% |
| Immigrants | Lithuania | 99.8 /100 | #18 | Exceptional 7.2% |
| Eastern Europeans | 99.7 /100 | #19 | Exceptional 7.2% |
| Immigrants | Hong Kong | 99.7 /100 | #20 | Exceptional 7.3% |
| Immigrants | Iran | 99.7 /100 | #21 | Exceptional 7.3% |
| Danes | 99.7 /100 | #22 | Exceptional 7.3% |
| Assyrians/Chaldeans/Syriacs | 99.7 /100 | #23 | Exceptional 7.3% |
| Croatians | 99.7 /100 | #24 | Exceptional 7.3% |
| Burmese | 99.7 /100 | #25 | Exceptional 7.3% |
| Cypriots | 99.6 /100 | #26 | Exceptional 7.3% |
| Immigrants | Scotland | 99.6 /100 | #27 | Exceptional 7.3% |
| Immigrants | Korea | 99.6 /100 | #28 | Exceptional 7.4% |
| Immigrants | Northern Europe | 99.6 /100 | #29 | Exceptional 7.4% |
| Italians | 99.6 /100 | #30 | Exceptional 7.4% |
Demographics Similar to Immigrants from Portugal by Family Poverty
In terms of family poverty, the demographic groups most similar to Immigrants from Portugal are Immigrants from Sierra Leone (9.4%, a difference of 0.17%), German Russian (9.4%, a difference of 0.21%), Immigrants from Costa Rica (9.4%, a difference of 0.23%), Immigrants from Lebanon (9.4%, a difference of 0.31%), and Spaniard (9.4%, a difference of 0.42%).
| Demographics | Rating | Rank | Family Poverty |
| South Americans | 28.1 /100 | #194 | Fair 9.3% |
| Venezuelans | 27.4 /100 | #195 | Fair 9.3% |
| Immigrants | Venezuela | 26.1 /100 | #196 | Fair 9.3% |
| Immigrants | Colombia | 24.4 /100 | #197 | Fair 9.3% |
| Iraqis | 24.2 /100 | #198 | Fair 9.3% |
| Spaniards | 22.8 /100 | #199 | Fair 9.4% |
| Immigrants | Costa Rica | 21.7 /100 | #200 | Fair 9.4% |
| Immigrants | Portugal | 20.5 /100 | #201 | Fair 9.4% |
| Immigrants | Sierra Leone | 19.6 /100 | #202 | Poor 9.4% |
| German Russians | 19.4 /100 | #203 | Poor 9.4% |
| Immigrants | Lebanon | 18.9 /100 | #204 | Poor 9.4% |
| Aleuts | 18.0 /100 | #205 | Poor 9.5% |
| Immigrants | South America | 18.0 /100 | #206 | Poor 9.5% |
| Sierra Leoneans | 15.6 /100 | #207 | Poor 9.5% |
| Immigrants | Eastern Africa | 15.1 /100 | #208 | Poor 9.5% |