Assyrian/Chaldean/Syriac vs Arab Family Poverty
COMPARE
Assyrian/Chaldean/Syriac
Arab
Family Poverty
Family Poverty Comparison
Assyrians/Chaldeans/Syriacs
Arabs
7.3%
FAMILY POVERTY
99.7/ 100
METRIC RATING
23rd/ 347
METRIC RANK
9.2%
FAMILY POVERTY
31.5/ 100
METRIC RATING
190th/ 347
METRIC RANK
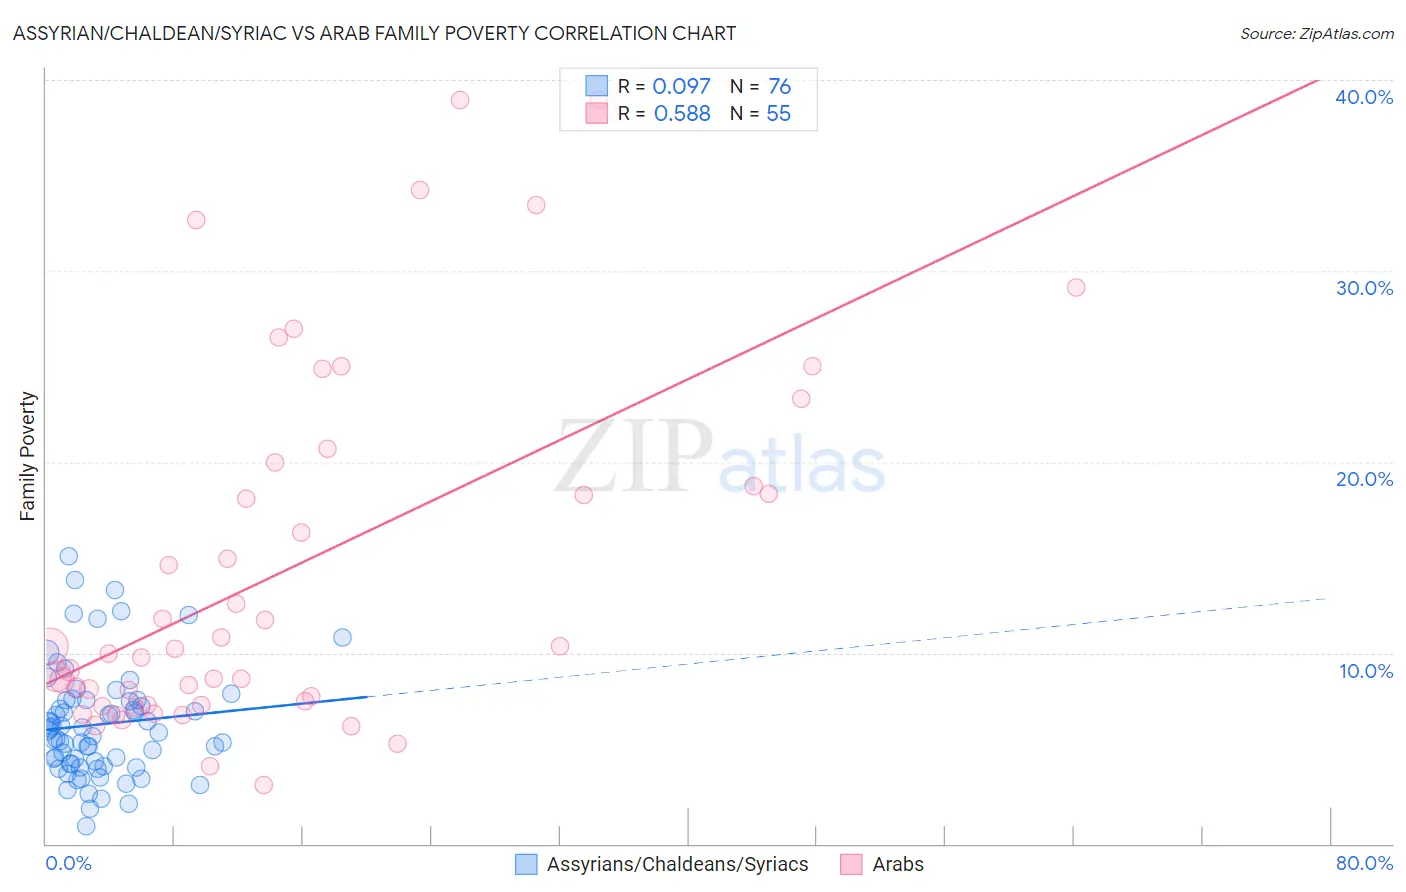
Assyrian/Chaldean/Syriac vs Arab Family Poverty Correlation Chart
The statistical analysis conducted on geographies consisting of 110,238,893 people shows a slight positive correlation between the proportion of Assyrians/Chaldeans/Syriacs and poverty level among families in the United States with a correlation coefficient (R) of 0.097 and weighted average of 7.3%. Similarly, the statistical analysis conducted on geographies consisting of 484,664,597 people shows a substantial positive correlation between the proportion of Arabs and poverty level among families in the United States with a correlation coefficient (R) of 0.588 and weighted average of 9.2%, a difference of 26.5%.
Family Poverty Correlation Summary
| Measurement | Assyrian/Chaldean/Syriac | Arab |
| Minimum | 0.89% | 3.1% |
| Maximum | 15.1% | 39.0% |
| Range | 14.2% | 35.9% |
| Mean | 6.3% | 14.5% |
| Median | 5.9% | 10.2% |
| Interquartile 25% (IQ1) | 4.2% | 7.3% |
| Interquartile 75% (IQ3) | 7.5% | 19.9% |
| Interquartile Range (IQR) | 3.3% | 12.6% |
| Standard Deviation (Sample) | 2.9% | 9.5% |
| Standard Deviation (Population) | 2.9% | 9.4% |
Similar Demographics by Family Poverty
Demographics Similar to Assyrians/Chaldeans/Syriacs by Family Poverty
In terms of family poverty, the demographic groups most similar to Assyrians/Chaldeans/Syriacs are Danish (7.3%, a difference of 0.010%), Croatian (7.3%, a difference of 0.30%), Burmese (7.3%, a difference of 0.30%), Immigrants from Iran (7.3%, a difference of 0.45%), and Cypriot (7.3%, a difference of 0.55%).
| Demographics | Rating | Rank | Family Poverty |
| Immigrants | South Central Asia | 99.8 /100 | #16 | Exceptional 7.2% |
| Luxembourgers | 99.8 /100 | #17 | Exceptional 7.2% |
| Immigrants | Lithuania | 99.8 /100 | #18 | Exceptional 7.2% |
| Eastern Europeans | 99.7 /100 | #19 | Exceptional 7.2% |
| Immigrants | Hong Kong | 99.7 /100 | #20 | Exceptional 7.3% |
| Immigrants | Iran | 99.7 /100 | #21 | Exceptional 7.3% |
| Danes | 99.7 /100 | #22 | Exceptional 7.3% |
| Assyrians/Chaldeans/Syriacs | 99.7 /100 | #23 | Exceptional 7.3% |
| Croatians | 99.7 /100 | #24 | Exceptional 7.3% |
| Burmese | 99.7 /100 | #25 | Exceptional 7.3% |
| Cypriots | 99.6 /100 | #26 | Exceptional 7.3% |
| Immigrants | Scotland | 99.6 /100 | #27 | Exceptional 7.3% |
| Immigrants | Korea | 99.6 /100 | #28 | Exceptional 7.4% |
| Immigrants | Northern Europe | 99.6 /100 | #29 | Exceptional 7.4% |
| Italians | 99.6 /100 | #30 | Exceptional 7.4% |
Demographics Similar to Arabs by Family Poverty
In terms of family poverty, the demographic groups most similar to Arabs are Immigrants from Afghanistan (9.2%, a difference of 0.090%), Immigrants from Kenya (9.2%, a difference of 0.37%), Ugandan (9.3%, a difference of 0.41%), Spanish (9.3%, a difference of 0.42%), and Immigrants from Western Asia (9.3%, a difference of 0.50%).
| Demographics | Rating | Rank | Family Poverty |
| Uruguayans | 39.2 /100 | #183 | Fair 9.1% |
| South American Indians | 38.7 /100 | #184 | Fair 9.1% |
| Immigrants | Saudi Arabia | 38.6 /100 | #185 | Fair 9.1% |
| Colombians | 36.1 /100 | #186 | Fair 9.2% |
| Delaware | 35.4 /100 | #187 | Fair 9.2% |
| Immigrants | Kenya | 34.0 /100 | #188 | Fair 9.2% |
| Immigrants | Afghanistan | 32.1 /100 | #189 | Fair 9.2% |
| Arabs | 31.5 /100 | #190 | Fair 9.2% |
| Ugandans | 28.7 /100 | #191 | Fair 9.3% |
| Spanish | 28.7 /100 | #192 | Fair 9.3% |
| Immigrants | Western Asia | 28.2 /100 | #193 | Fair 9.3% |
| South Americans | 28.1 /100 | #194 | Fair 9.3% |
| Venezuelans | 27.4 /100 | #195 | Fair 9.3% |
| Immigrants | Venezuela | 26.1 /100 | #196 | Fair 9.3% |
| Immigrants | Colombia | 24.4 /100 | #197 | Fair 9.3% |