Assyrian/Chaldean/Syriac vs U.S. Virgin Islander Family Poverty
COMPARE
Assyrian/Chaldean/Syriac
U.S. Virgin Islander
Family Poverty
Family Poverty Comparison
Assyrians/Chaldeans/Syriacs
U.S. Virgin Islanders
7.3%
FAMILY POVERTY
99.7/ 100
METRIC RATING
23rd/ 347
METRIC RANK
12.4%
FAMILY POVERTY
0.0/ 100
METRIC RATING
318th/ 347
METRIC RANK
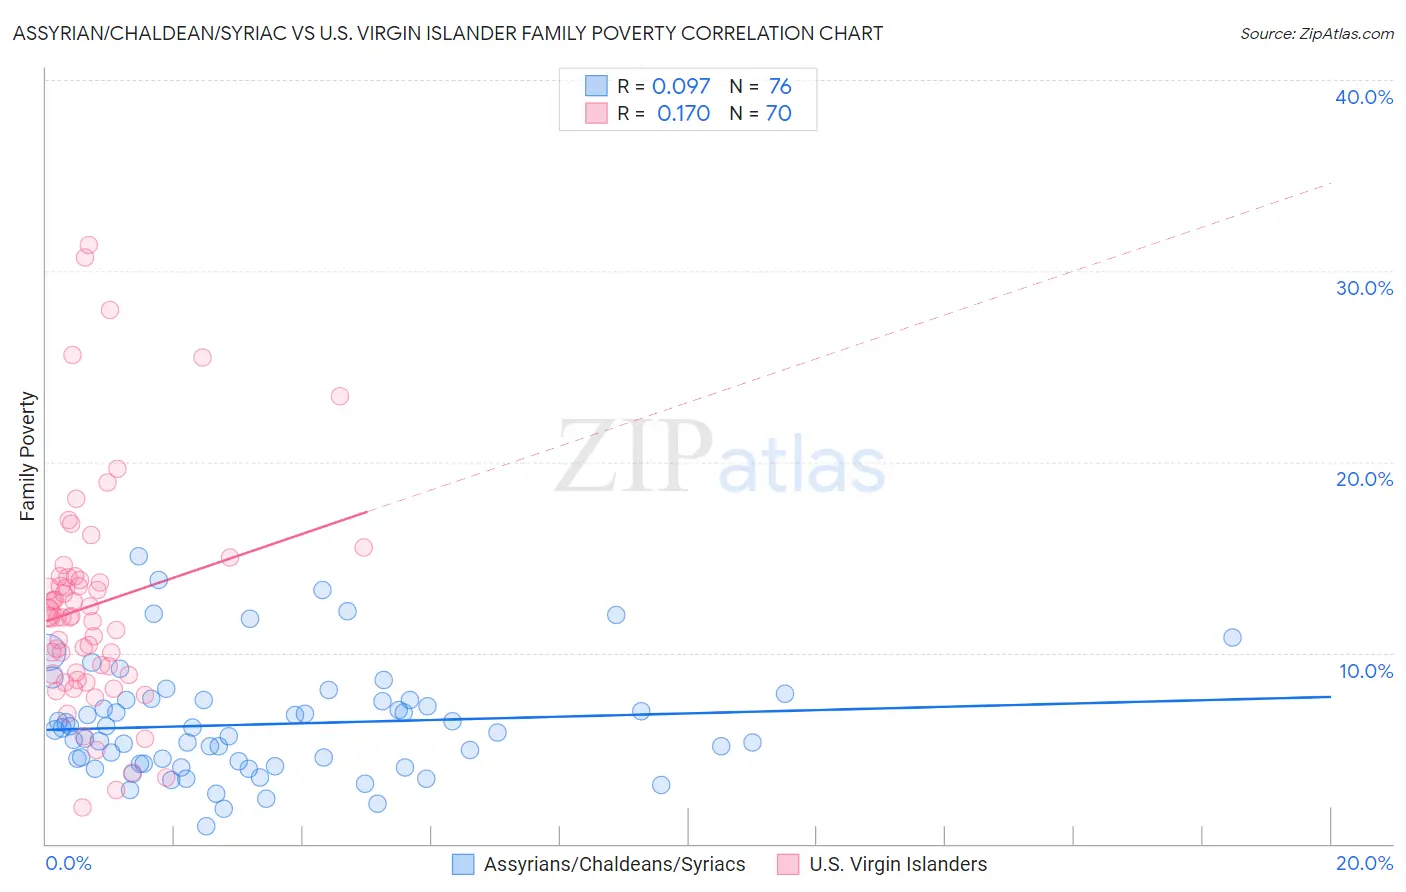
Assyrian/Chaldean/Syriac vs U.S. Virgin Islander Family Poverty Correlation Chart
The statistical analysis conducted on geographies consisting of 110,238,893 people shows a slight positive correlation between the proportion of Assyrians/Chaldeans/Syriacs and poverty level among families in the United States with a correlation coefficient (R) of 0.097 and weighted average of 7.3%. Similarly, the statistical analysis conducted on geographies consisting of 87,485,330 people shows a poor positive correlation between the proportion of U.S. Virgin Islanders and poverty level among families in the United States with a correlation coefficient (R) of 0.170 and weighted average of 12.4%, a difference of 69.8%.
Family Poverty Correlation Summary
| Measurement | Assyrian/Chaldean/Syriac | U.S. Virgin Islander |
| Minimum | 0.89% | 1.9% |
| Maximum | 15.1% | 31.4% |
| Range | 14.2% | 29.5% |
| Mean | 6.3% | 12.5% |
| Median | 5.9% | 11.9% |
| Interquartile 25% (IQ1) | 4.2% | 8.9% |
| Interquartile 75% (IQ3) | 7.5% | 14.0% |
| Interquartile Range (IQR) | 3.3% | 5.1% |
| Standard Deviation (Sample) | 2.9% | 5.9% |
| Standard Deviation (Population) | 2.9% | 5.9% |
Similar Demographics by Family Poverty
Demographics Similar to Assyrians/Chaldeans/Syriacs by Family Poverty
In terms of family poverty, the demographic groups most similar to Assyrians/Chaldeans/Syriacs are Danish (7.3%, a difference of 0.010%), Croatian (7.3%, a difference of 0.30%), Burmese (7.3%, a difference of 0.30%), Immigrants from Iran (7.3%, a difference of 0.45%), and Cypriot (7.3%, a difference of 0.55%).
| Demographics | Rating | Rank | Family Poverty |
| Immigrants | South Central Asia | 99.8 /100 | #16 | Exceptional 7.2% |
| Luxembourgers | 99.8 /100 | #17 | Exceptional 7.2% |
| Immigrants | Lithuania | 99.8 /100 | #18 | Exceptional 7.2% |
| Eastern Europeans | 99.7 /100 | #19 | Exceptional 7.2% |
| Immigrants | Hong Kong | 99.7 /100 | #20 | Exceptional 7.3% |
| Immigrants | Iran | 99.7 /100 | #21 | Exceptional 7.3% |
| Danes | 99.7 /100 | #22 | Exceptional 7.3% |
| Assyrians/Chaldeans/Syriacs | 99.7 /100 | #23 | Exceptional 7.3% |
| Croatians | 99.7 /100 | #24 | Exceptional 7.3% |
| Burmese | 99.7 /100 | #25 | Exceptional 7.3% |
| Cypriots | 99.6 /100 | #26 | Exceptional 7.3% |
| Immigrants | Scotland | 99.6 /100 | #27 | Exceptional 7.3% |
| Immigrants | Korea | 99.6 /100 | #28 | Exceptional 7.4% |
| Immigrants | Northern Europe | 99.6 /100 | #29 | Exceptional 7.4% |
| Italians | 99.6 /100 | #30 | Exceptional 7.4% |
Demographics Similar to U.S. Virgin Islanders by Family Poverty
In terms of family poverty, the demographic groups most similar to U.S. Virgin Islanders are Immigrants from Grenada (12.4%, a difference of 0.010%), British West Indian (12.4%, a difference of 0.050%), Honduran (12.4%, a difference of 0.22%), Inupiat (12.5%, a difference of 0.53%), and Immigrants from Mexico (12.3%, a difference of 0.96%).
| Demographics | Rating | Rank | Family Poverty |
| Ute | 0.0 /100 | #311 | Tragic 12.1% |
| Immigrants | Central America | 0.0 /100 | #312 | Tragic 12.1% |
| Immigrants | Caribbean | 0.0 /100 | #313 | Tragic 12.2% |
| Kiowa | 0.0 /100 | #314 | Tragic 12.2% |
| Immigrants | Mexico | 0.0 /100 | #315 | Tragic 12.3% |
| Hondurans | 0.0 /100 | #316 | Tragic 12.4% |
| Immigrants | Grenada | 0.0 /100 | #317 | Tragic 12.4% |
| U.S. Virgin Islanders | 0.0 /100 | #318 | Tragic 12.4% |
| British West Indians | 0.0 /100 | #319 | Tragic 12.4% |
| Inupiat | 0.0 /100 | #320 | Tragic 12.5% |
| Arapaho | 0.0 /100 | #321 | Tragic 12.7% |
| Immigrants | Honduras | 0.0 /100 | #322 | Tragic 12.7% |
| Menominee | 0.0 /100 | #323 | Tragic 12.7% |
| Immigrants | Dominica | 0.0 /100 | #324 | Tragic 12.7% |
| Paiute | 0.0 /100 | #325 | Tragic 13.0% |