African vs Immigrants from Portugal Family Poverty
COMPARE
African
Immigrants from Portugal
Family Poverty
Family Poverty Comparison
Africans
Immigrants from Portugal
11.8%
FAMILY POVERTY
0.0/ 100
METRIC RATING
303rd/ 347
METRIC RANK
9.4%
FAMILY POVERTY
20.5/ 100
METRIC RATING
201st/ 347
METRIC RANK
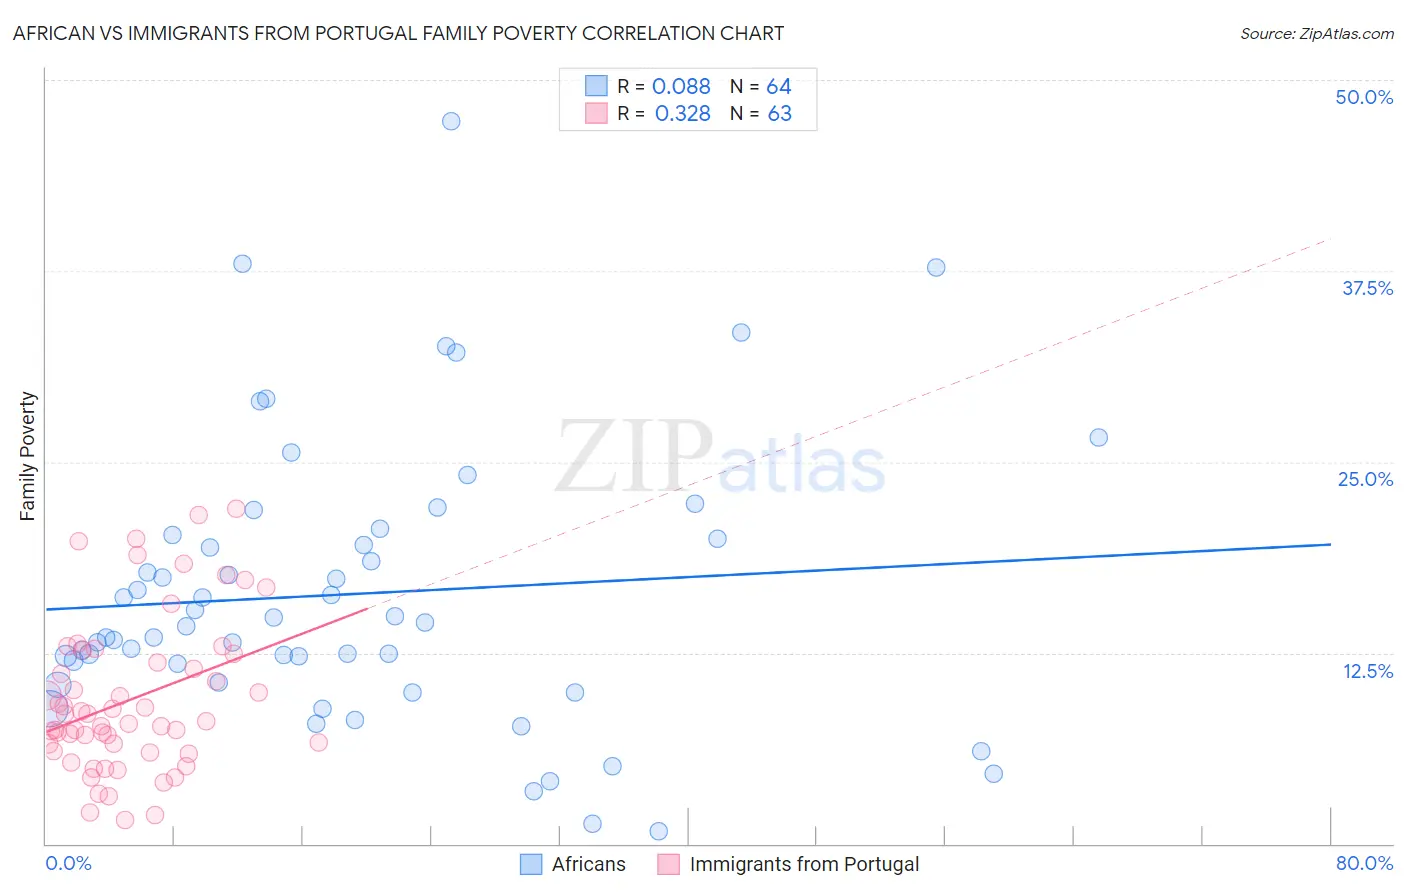
African vs Immigrants from Portugal Family Poverty Correlation Chart
The statistical analysis conducted on geographies consisting of 468,652,941 people shows a slight positive correlation between the proportion of Africans and poverty level among families in the United States with a correlation coefficient (R) of 0.088 and weighted average of 11.8%. Similarly, the statistical analysis conducted on geographies consisting of 174,489,914 people shows a mild positive correlation between the proportion of Immigrants from Portugal and poverty level among families in the United States with a correlation coefficient (R) of 0.328 and weighted average of 9.4%, a difference of 25.2%.
Family Poverty Correlation Summary
| Measurement | African | Immigrants from Portugal |
| Minimum | 0.78% | 1.6% |
| Maximum | 47.3% | 21.9% |
| Range | 46.5% | 20.4% |
| Mean | 16.4% | 9.4% |
| Median | 14.4% | 8.0% |
| Interquartile 25% (IQ1) | 11.2% | 6.1% |
| Interquartile 75% (IQ3) | 20.1% | 12.5% |
| Interquartile Range (IQR) | 9.0% | 6.4% |
| Standard Deviation (Sample) | 9.2% | 5.0% |
| Standard Deviation (Population) | 9.1% | 4.9% |
Similar Demographics by Family Poverty
Demographics Similar to Africans by Family Poverty
In terms of family poverty, the demographic groups most similar to Africans are Immigrants from Latin America (11.8%, a difference of 0.19%), Mexican (11.8%, a difference of 0.37%), Guatemalan (11.7%, a difference of 0.50%), Bahamian (11.7%, a difference of 0.54%), and Immigrants from Bangladesh (11.7%, a difference of 0.80%).
| Demographics | Rating | Rank | Family Poverty |
| Choctaw | 0.0 /100 | #296 | Tragic 11.6% |
| Creek | 0.0 /100 | #297 | Tragic 11.7% |
| Immigrants | Senegal | 0.0 /100 | #298 | Tragic 11.7% |
| Dutch West Indians | 0.0 /100 | #299 | Tragic 11.7% |
| Immigrants | Bangladesh | 0.0 /100 | #300 | Tragic 11.7% |
| Bahamians | 0.0 /100 | #301 | Tragic 11.7% |
| Guatemalans | 0.0 /100 | #302 | Tragic 11.7% |
| Africans | 0.0 /100 | #303 | Tragic 11.8% |
| Immigrants | Latin America | 0.0 /100 | #304 | Tragic 11.8% |
| Mexicans | 0.0 /100 | #305 | Tragic 11.8% |
| Cajuns | 0.0 /100 | #306 | Tragic 11.9% |
| Immigrants | Congo | 0.0 /100 | #307 | Tragic 11.9% |
| Seminole | 0.0 /100 | #308 | Tragic 11.9% |
| Hispanics or Latinos | 0.0 /100 | #309 | Tragic 12.0% |
| Immigrants | Guatemala | 0.0 /100 | #310 | Tragic 12.0% |
Demographics Similar to Immigrants from Portugal by Family Poverty
In terms of family poverty, the demographic groups most similar to Immigrants from Portugal are Immigrants from Sierra Leone (9.4%, a difference of 0.17%), German Russian (9.4%, a difference of 0.21%), Immigrants from Costa Rica (9.4%, a difference of 0.23%), Immigrants from Lebanon (9.4%, a difference of 0.31%), and Spaniard (9.4%, a difference of 0.42%).
| Demographics | Rating | Rank | Family Poverty |
| South Americans | 28.1 /100 | #194 | Fair 9.3% |
| Venezuelans | 27.4 /100 | #195 | Fair 9.3% |
| Immigrants | Venezuela | 26.1 /100 | #196 | Fair 9.3% |
| Immigrants | Colombia | 24.4 /100 | #197 | Fair 9.3% |
| Iraqis | 24.2 /100 | #198 | Fair 9.3% |
| Spaniards | 22.8 /100 | #199 | Fair 9.4% |
| Immigrants | Costa Rica | 21.7 /100 | #200 | Fair 9.4% |
| Immigrants | Portugal | 20.5 /100 | #201 | Fair 9.4% |
| Immigrants | Sierra Leone | 19.6 /100 | #202 | Poor 9.4% |
| German Russians | 19.4 /100 | #203 | Poor 9.4% |
| Immigrants | Lebanon | 18.9 /100 | #204 | Poor 9.4% |
| Aleuts | 18.0 /100 | #205 | Poor 9.5% |
| Immigrants | South America | 18.0 /100 | #206 | Poor 9.5% |
| Sierra Leoneans | 15.6 /100 | #207 | Poor 9.5% |
| Immigrants | Eastern Africa | 15.1 /100 | #208 | Poor 9.5% |